Bitcoin continued trending downwards today after going through a flash crash over the weekend, briefly dipping to lows around $110,000.
Market sentiment turned sour with the crypto fear and greed index dipping back deep into neutral territory to 47, as traders switched back into risk-off mode.
At press time, total crypto market capitalization had dropped over 2% in the past 24 hours to $3.96 trillion.
Altcoins showed little resistance, with most large-cap tokens swimming in red amid the broader market unease.
Why is the Bitcoin price going down?
Bitcoin dropped under $110K after a major whale dumped 24,000 BTC on the market, which in turn triggered an avalanche of liquidations.
The size of the sell-off—worth over $2.6 billion at the time—unleashed a wave of forced selling that liquidated more than $550 million in leveraged long positions.
This sharp move erased weeks of slow upward momentum and caught many traders off guard.
The abrupt liquidation cascade didn’t just hit speculative positions—it also rattled confidence across the broader market.
As price briefly fell below the key psychological support near $110,000, traders began trimming risk exposure, opting to sit on the sidelines rather than try and catch a falling knife.
Volatility surged, and trading desks reported elevated funding rate swings across major exchanges.
Adding to the pressure, institutional flows also reversed course.
Global crypto exchange-traded products (ETPs) saw $1.43 billion in net outflows last week, according to CoinShares—snapping a two-week inflow streak that had pulled in $4.3 billion.
Bitcoin bore the brunt of that reversal, with investors rotating out of spot exposure as the asset failed to hold above the $116K level it reached just days earlier.
While the price has recovered slightly to hover around $111K–$112K, the market remains on edge.
All eyes are now on whether BTC can build a base above $112K or if another leg down awaits.
Will Bitcoin price crash?
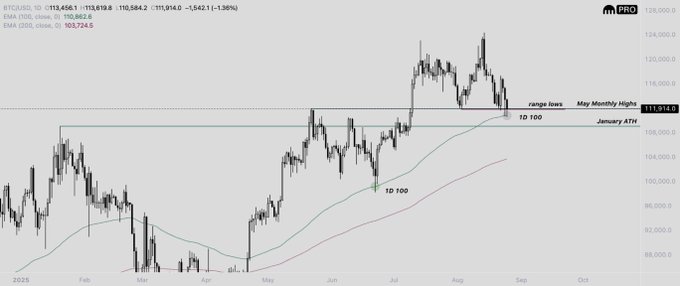
Right now, the $112K level has emerged as a fragile line of defence in the short term.
On August 25, BTC already dipped below this mark during intraday action, suggesting that the bulls are struggling to regain firm control.
If price fails to hold above this zone over the next few sessions, it could confirm a bearish breakdown and open the door to further losses, according to some market watchers.
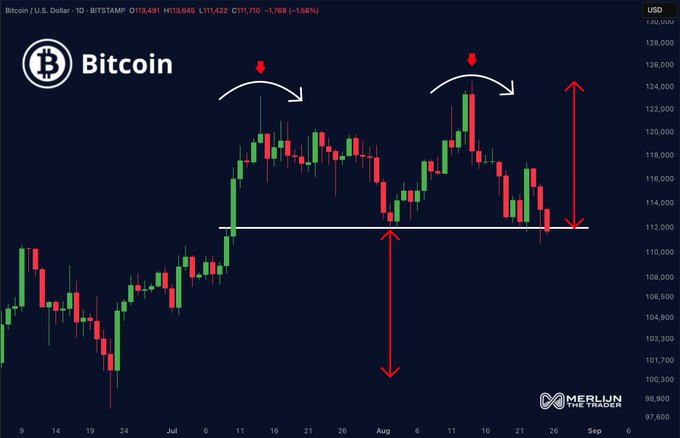
THE BITCOIN REALITY CHECK
Everyone loves the pump.
But the chart is screaming: Double Top.
$112K is the last stand.
If it breaks, $BTC won’t dip… it will cascade.
Weak hands get liquidated.
Strong hands reload.
Survive this wipeout, and you’ll come out a true legend.
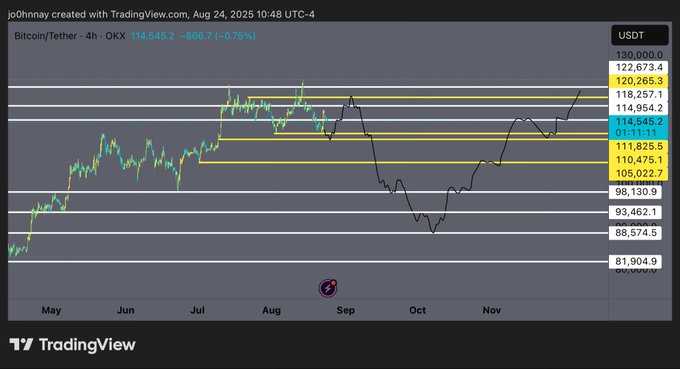
Data from CoinGlass’ 24-hour liquidation heatmap reveals significant concentrations of bid liquidity stacked in the $110,500 to $109,700 range.
These heat zones—highlighted in brighter green—point to areas where large buy orders could temporarily stabilise price or serve as magnet zones for liquidity sweeps.
But the pressure may not stop there. The heatmap also shows deeper bid walls building down toward $108,000, a sign that some traders expect the price to revisit lower supports before any meaningful bounce.
In essence, the market may be bracing for one final liquidity flush to absorb remaining leverage and set the stage for a recovery.
Such a move wouldn’t be unusual in a post-liquidation environment. When large clusters of long positions get wiped out, the price often seeks out remaining pockets of liquidity below support to complete the shakeout.
That means Bitcoin could still drift lower in the coming hours or days, even if temporarily, before sentiment resets.
For now, BTC remains stuck in no man’s land between weak support and heavy resistance, with the liquidation footprint hinting that another test of the lower ranges is not off the table.
Whether bulls step in at $110K or wait until $108K may determine how quickly Bitcoin finds its footing again.
A break below these levels would mean a visit towards “100k’s” according to pseudonymous analyst Dentoshi, who added that the market was in a “wait & see” mode.
Some more bad tidings came from fellow market watcher AlejandroBTC, who flagged a multi-month head and shoulders pattern, a classic bearish reversal setup, which now appears to be breaking down.
BTC/USD 12h price chart. Source: AlejandroBTC
Based on a BTC/USD 12h price chart, the analyst speculated a massive drop to lows around $50k.
On the contrary, some commentators expect a much less severe correction and a gradual recovery back towards previous highs in the coming months. See below.
For now, a short-term recovery may only be expected if BTC manages to stabilise above $112k, unless a major bullish catalyst hits the market.
When writing, Bitcoin was hovering just above the $112k mark with over 2% losses on the daily timeframe.
Altcoin prices today
In the past 24 hours, the altcoin market cap fell 1.7% to $1.69 trillion.
Ethereum (ETH), the largest altcoin by market capitalisation, declined 3.4%, ending its rally shortly after reaching an all-time high of $4,900, where it faced resistance at the $5,000 level.
The dip in ETH price also coincided with $370.6 million in liquidations, including $314.2 million from long positions, erasing much of the gains driven by Powell’s dovish signal on potential Fed rate cuts in September during the Jackson Hole rally.
Other major altcoins like XRP (XRP), Solana (SOL), Tron (TRX), Dogecoin (DOGE) and Cardano (ADA) experienced losses ranging between 2-5% respectively.
Within the top 100 altcoins, Hyperliquid (HYPE), BitTorrent (BTT), and VeChain (VET) recorded the day’s comparatively better performances, although their gains remained modest against the broader market downturn.