Dogecoin To $0.57 Or $0.06? Analyst Says DOGE’s Fate Hinges On This Level

Share:
An analyst has explained how Dogecoin could be at a make-or-break level right now based on a technical analysis (TA) chart pattern.
Dogecoin Is Retesting The Lower Bound Of An Ascending Channel
In a new post on X, analyst Ali Martinez has shared a TA pattern potentially forming in the meme coin’s 1-week price chart. The pattern in question is an Ascending Channel, which appears when an asset trades between two parallel trendlines slopped upwards.
As the price curve moves inside the channel, it observes consolidation toward the upside. The upper line of the pattern acts as a ceiling, providing resistance when the asset retests it. Similarly, the lower line acts as a point of support.
In the scenario that one of these levels breaks, the price can see a continuation of the trend in that direction. That is, a surge above the channel can be a bullish signal, while a drop under it is a bearish one.
Now, here is the chart posted by the analyst displaying the Ascending Channel that the weekly Dogecoin price has been traveling inside for the last few years:
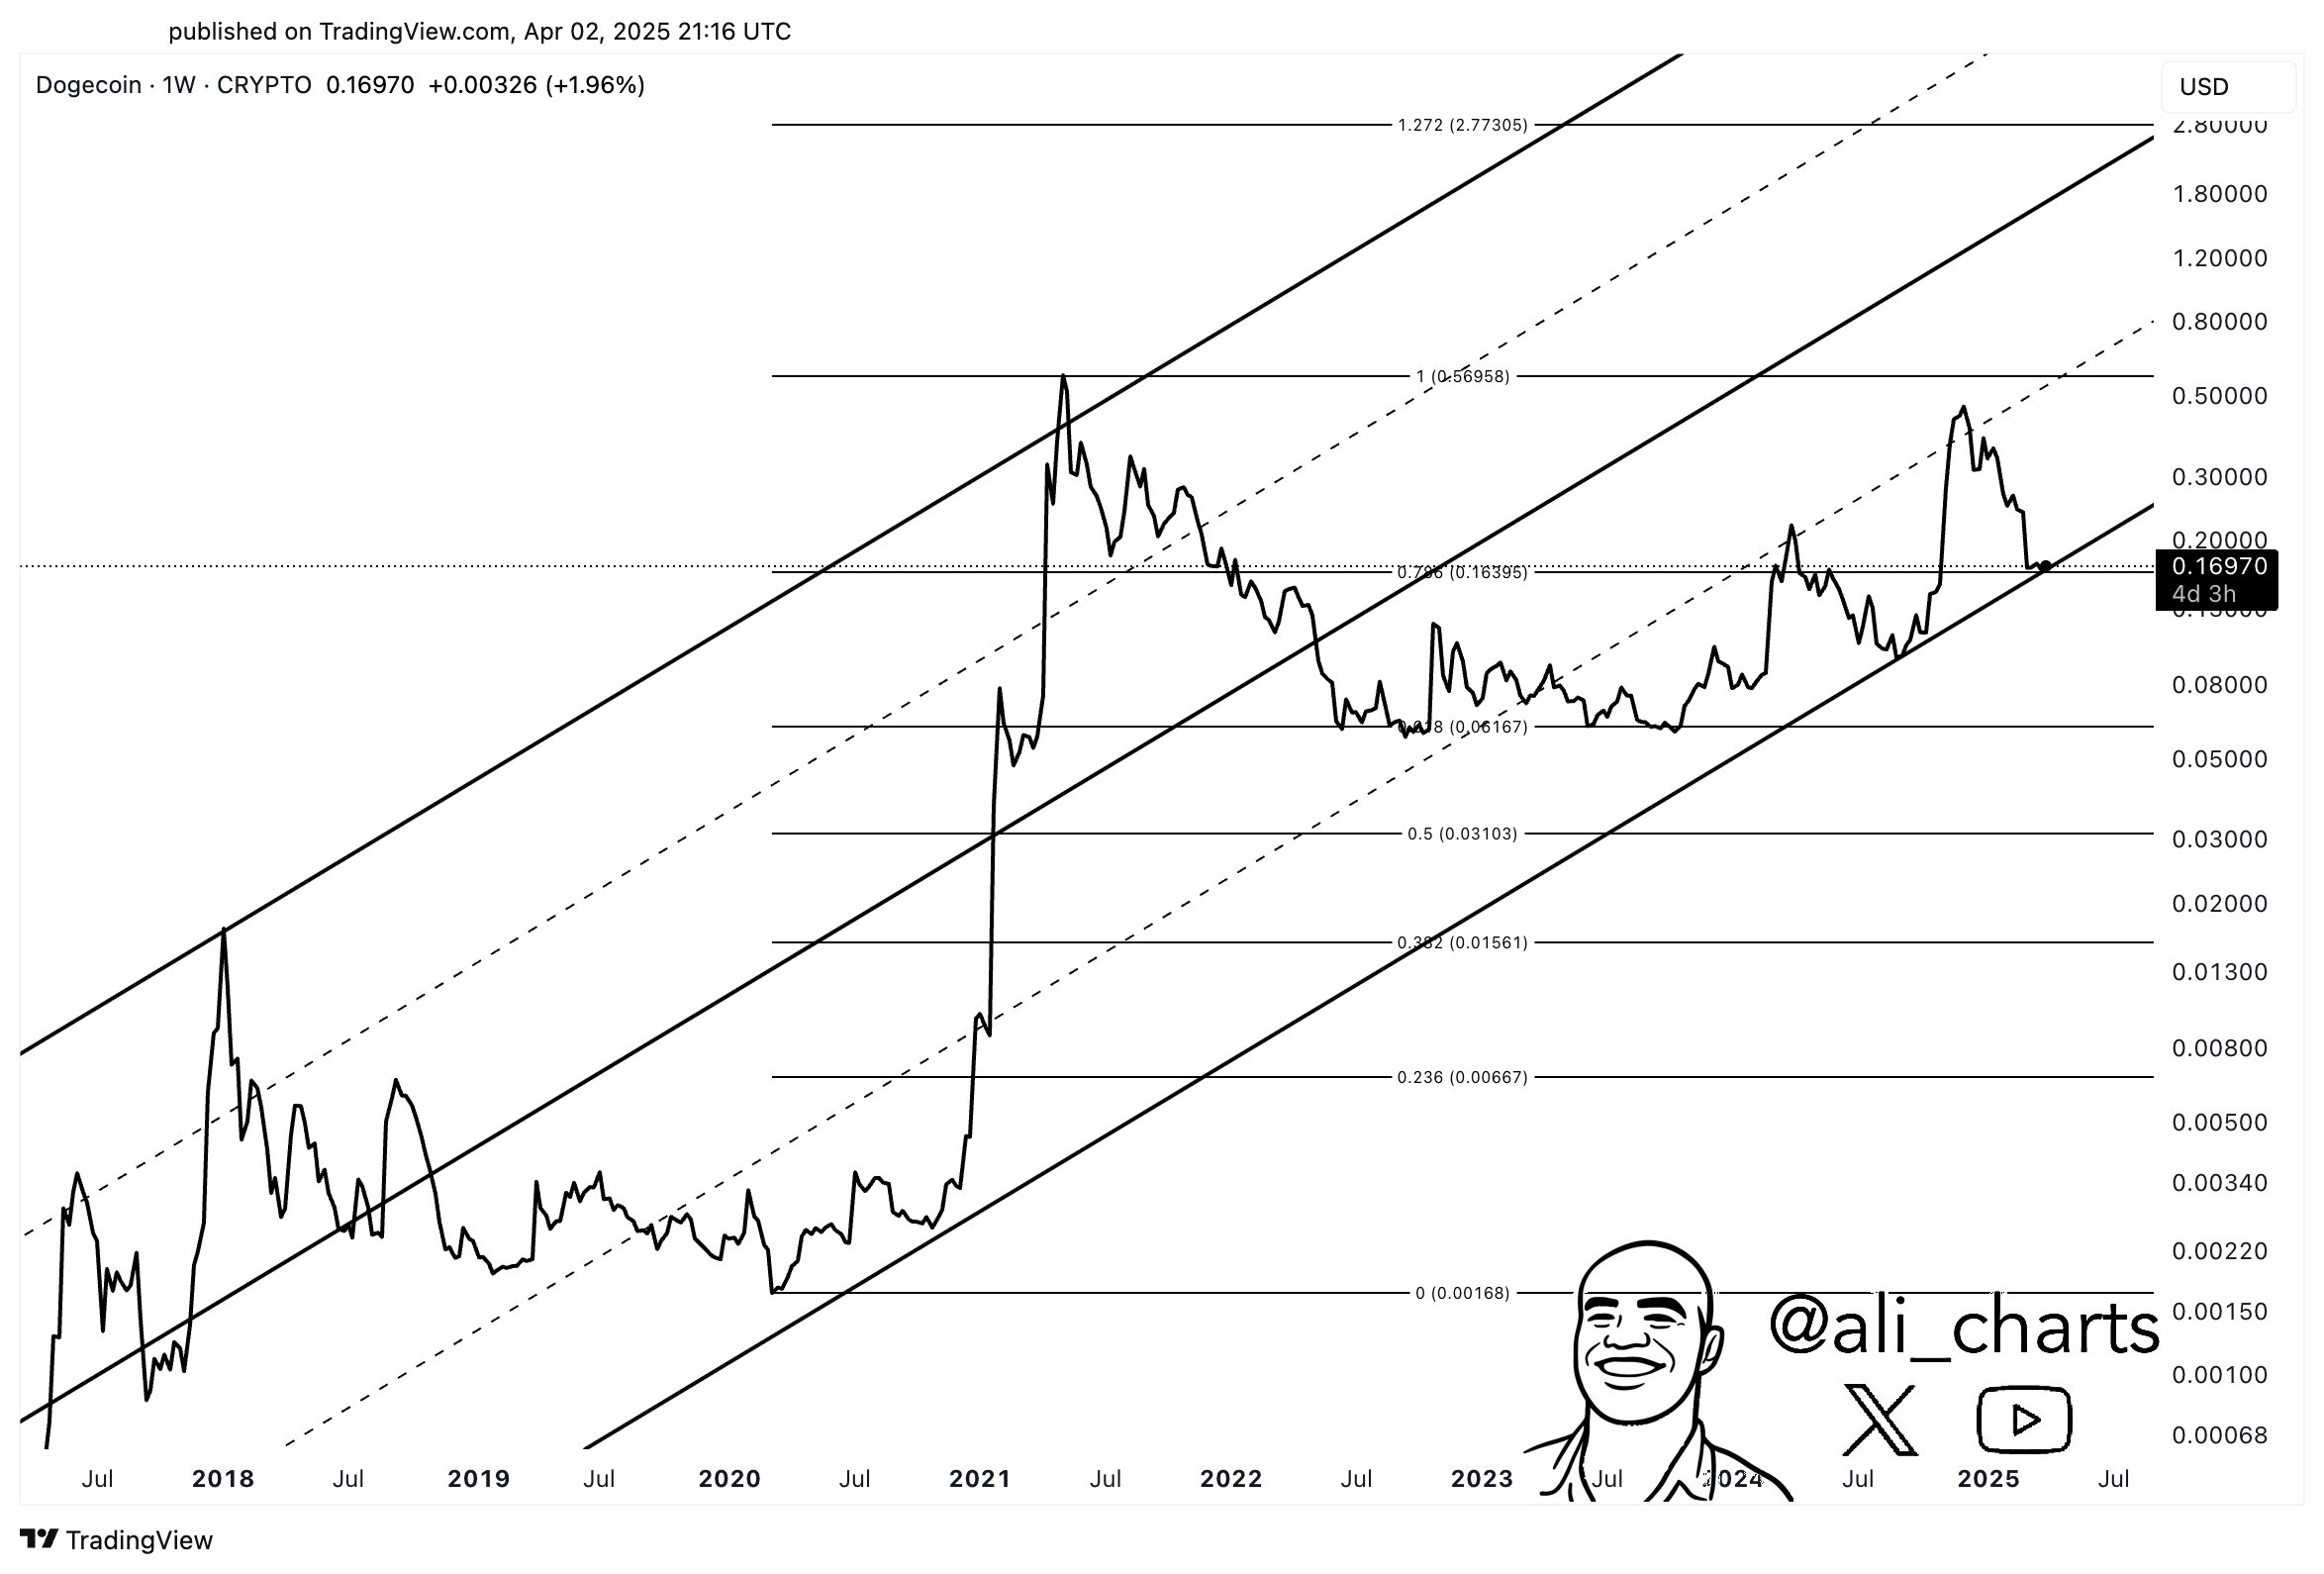
As is visible in the above graph, the 1-week price of Dogecoin has recently witnessed a plunge to the support level of this multi-year Ascending Channel, situated around $0.16.
The last time that the meme coin retested this line was last year and back then, the coin was able to find a successful bottom, which launched its price into a bull rally. Given this trend, the latest retest of the line could also prove to be crucial for the cryptocurrency, with the analyst even tagging the level as a ‘make-or-break’ one.
As for the potential scenarios that this retest can lead to, the analyst has noted, “if $0.16 holds, a rally to $0.57 could follow. If it fails, a drop to $0.06 becomes likely.”
These targets are based on the Fibonacci Retracement levels, which are lines that correspond to important ratios from the popular Fibonacci series. Fibonacci Retracement levels are taken from a specific price top, with the point of the top corresponding to the 1 level.
From the chart, it’s visible that DOGE is currently trading almost exactly at the 0.786 level, making the asset’s current retest have another layer of significance. A breakdown could send the coin to the next retracement level, 0.618, which corresponds to the $0.06 target that the analyst has given.
Similarly, a surge upward could help Dogecoin touch the higher 1 level, situated around $0.57. It now remains to be seen how the memecoin’s retest would go.
DOGE Price
Dogecoin has had a bearish past day as it has dropped to $0.16 following a drawdown of more than 8%.


Read More

How Did The Dogecoin Price React To Elon Musk’s Latest Dog Post?

Analyst Highlights Interesting Dogecoin Double Top Adam & Eve Pattern
Dogecoin To $0.57 Or $0.06? Analyst Says DOGE’s Fate Hinges On This Level
Share:
An analyst has explained how Dogecoin could be at a make-or-break level right now based on a technical analysis (TA) chart pattern.
Dogecoin Is Retesting The Lower Bound Of An Ascending Channel
In a new post on X, analyst Ali Martinez has shared a TA pattern potentially forming in the meme coin’s 1-week price chart. The pattern in question is an Ascending Channel, which appears when an asset trades between two parallel trendlines slopped upwards.
As the price curve moves inside the channel, it observes consolidation toward the upside. The upper line of the pattern acts as a ceiling, providing resistance when the asset retests it. Similarly, the lower line acts as a point of support.
In the scenario that one of these levels breaks, the price can see a continuation of the trend in that direction. That is, a surge above the channel can be a bullish signal, while a drop under it is a bearish one.
Now, here is the chart posted by the analyst displaying the Ascending Channel that the weekly Dogecoin price has been traveling inside for the last few years:
As is visible in the above graph, the 1-week price of Dogecoin has recently witnessed a plunge to the support level of this multi-year Ascending Channel, situated around $0.16.
The last time that the meme coin retested this line was last year and back then, the coin was able to find a successful bottom, which launched its price into a bull rally. Given this trend, the latest retest of the line could also prove to be crucial for the cryptocurrency, with the analyst even tagging the level as a ‘make-or-break’ one.
As for the potential scenarios that this retest can lead to, the analyst has noted, “if $0.16 holds, a rally to $0.57 could follow. If it fails, a drop to $0.06 becomes likely.”
These targets are based on the Fibonacci Retracement levels, which are lines that correspond to important ratios from the popular Fibonacci series. Fibonacci Retracement levels are taken from a specific price top, with the point of the top corresponding to the 1 level.
From the chart, it’s visible that DOGE is currently trading almost exactly at the 0.786 level, making the asset’s current retest have another layer of significance. A breakdown could send the coin to the next retracement level, 0.618, which corresponds to the $0.06 target that the analyst has given.
Similarly, a surge upward could help Dogecoin touch the higher 1 level, situated around $0.57. It now remains to be seen how the memecoin’s retest would go.
DOGE Price
Dogecoin has had a bearish past day as it has dropped to $0.16 following a drawdown of more than 8%.
Read More
How Did The Dogecoin Price React To Elon Musk’s Latest Dog Post?