SEI Price Tests $0.04 Support—Can Rising Network Activity Fuel a Recovery Rally?

Share:
SEI is trading near $0.04 inside a falling wedge, holding $0.039–$0.040 support with RSI around 40.67 and immediate resistance at $0.045 followed by major supply zones at $0.055–$0.06 and $0.065–$0.078. Network activity has modestly recovered with about 2.5K daily active addresses and a seven-day transaction total near 104.6K, but the recovery is tentative and a sustained breakout above $0.045 and then $0.055 to $0.06 is needed to confirm bullish adoption while a drop below $0.039 would invalidate the setup.
Predictions Markets
See what traders are focused on

The SEI price is holding near the $0.04 level after a prolonged decline, testing the lower boundary of its descending structure. At the same time, network activity has shown signs of improvement, raising hopes that demand could begin supporting a recovery. With $0.045 acting as the first major hurdle, can SEI break higher and target the $0.055–$0.06 zone, or will the ongoing downtrend push the price below key support?
SEI Technical Structure Shows a Potential Recovery Setup
The SEI price remains within a falling wedge, forming lower highs while gradually moving toward the lower boundary around $0.039–$0.040. However, SEI still faces multiple supply areas overhead, with the first resistance near $0.045, followed by a stronger supply zone around $0.055–$0.060 and larger resistance between $0.065 and $0.078. The Supply & Demand CVD Flow indicator highlights these zones as areas where selling pressure has previously emerged, making them important hurdles for any recovery.
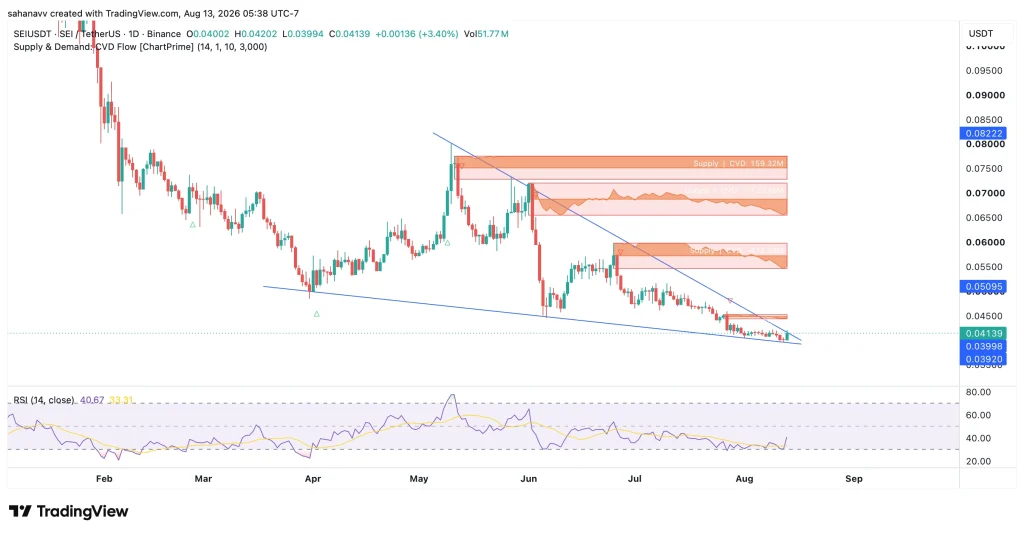
Momentum is showing early signs of improvement as the RSI stands around 40.67, recovering from the lower levels seen during the recent decline, while remaining below the neutral 50 mark. A move above 50 would provide stronger confirmation that bullish momentum is returning. For now, SEI price needs to reclaim the $0.045 resistance and break above the descending trendline before the recovery can develop into a larger reversal. Until then, the broader downtrend remains intact despite the recent bounce from support.
SEI Network Activity Shows Signs of Recovery
SEI network activity has shown some improvement in recent days, with daily active addresses rising to around 2.5K after remaining closer to the 1.5K–2K range earlier in the week. Transaction activity has also remained notable, reaching a 7-day total of approximately 104.6K, although the daily count has fluctuated sharply.
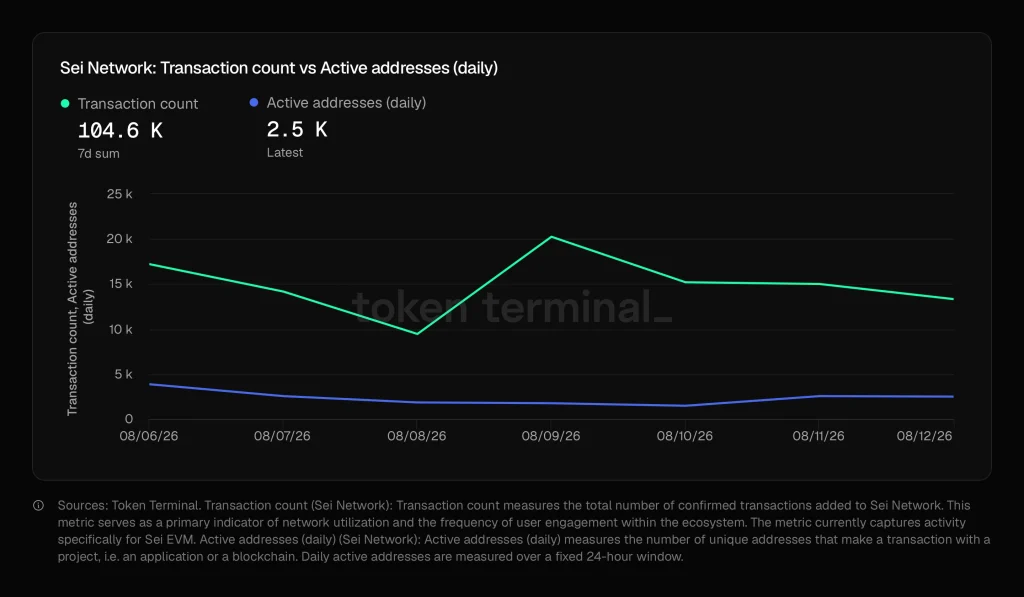
The increase in active addresses suggests that network participation is beginning to recover, but the move is still relatively modest and needs to remain sustained to provide stronger confirmation of growing demand. If network activity continues to strengthen while SEI holds its $0.039–$0.040 support, it could add credibility to the broader recovery setup.
Key Levels to Monitor
- $0.039–$0.040: Key support zone that bulls need to defend to maintain the current recovery setup.
- $0.045: Immediate resistance and the first-level SEI needs to reclaim for stronger bullish momentum.
- $0.055–$0.060: Major supply zone and the next significant hurdle after a breakout above $0.045.
- $0.065–$0.072: Stronger overhead resistance where previous selling pressure could limit the recovery.
- $0.075–$0.078: Major supply zone and a crucial barrier for any move toward a broader trend reversal.
- Below $0.039: A decisive breakdown could invalidate the current recovery setup and strengthen the bearish structure.
Can SEI Price Break Above $0.045?
The SEI price is showing early signs of a potential recovery after holding the $0.039–$0.040 support zone, while improving network activity adds some strength to the bullish case. However, the price still faces multiple supply zones, with $0.045 acting as the first major hurdle before the $0.055–$0.060 region comes into focus. A sustained breakout above these levels could signal a broader reversal, while a loss of $0.039 would put the recovery setup at risk.


Predictions Markets
See what traders are focused on
Share:
Predictions Markets
See what traders are focused on
Share:
Read More

Curve DAO (CRV) Price Pulls Back After Strong Rally — Can Bulls Defend $0.20 Support?