Bitcoin’s Next Stop: $75,500? Analyst Reveals Historical ‘Magnet’ Level

An analyst has pointed out how the 50-week moving average (MA) of Bitcoin has historically acted as a sort of magnet for the asset’s price.
50-Week MA Is Currently Situated At $75,500 For Bitcoin
In a new post on X, analyst Ali Martinez has discussed about the 50-week MA of Bitcoin. An “MA” is a technical analysis indicator that calculates the average value of any asset’s price over a given period of time and as its name suggests, moves in time, updating its value according to the changes in the price itself.
MAs can be useful tools for studying long-term trends in an asset, as they smooth out the price curve to remove any local deviations. An MA can be taken over any window of time, but there are some particularly popular choices like the 200-day.
In the context of the current topic, the time-range of focus is the 50-week. Here is the chart shared by the analyst, that shows the trend in this MA for Bitcoin over the past decade or so:

As is visible in the above graph, Bitcoin has been approaching this line following the latest market downturn. The asset has previously shown several retests of this level over the years.
“The 50-week moving average has historically acted as a magnet for Bitcoin $BTC during trend shifts,” explains Martinez. So far in the current cycle, the line has acted as support for the cryptocurrency, helping prevent the bull run from running out of steam.
At present, the 50-week MA is situated at $75,500. Given the current trajectory of the asset, it’s possible that a retest of the level may end up taking place once more. It only remains to be seen, though, whether the level would again provide support to Bitcoin, or if it would usher in the bear market.
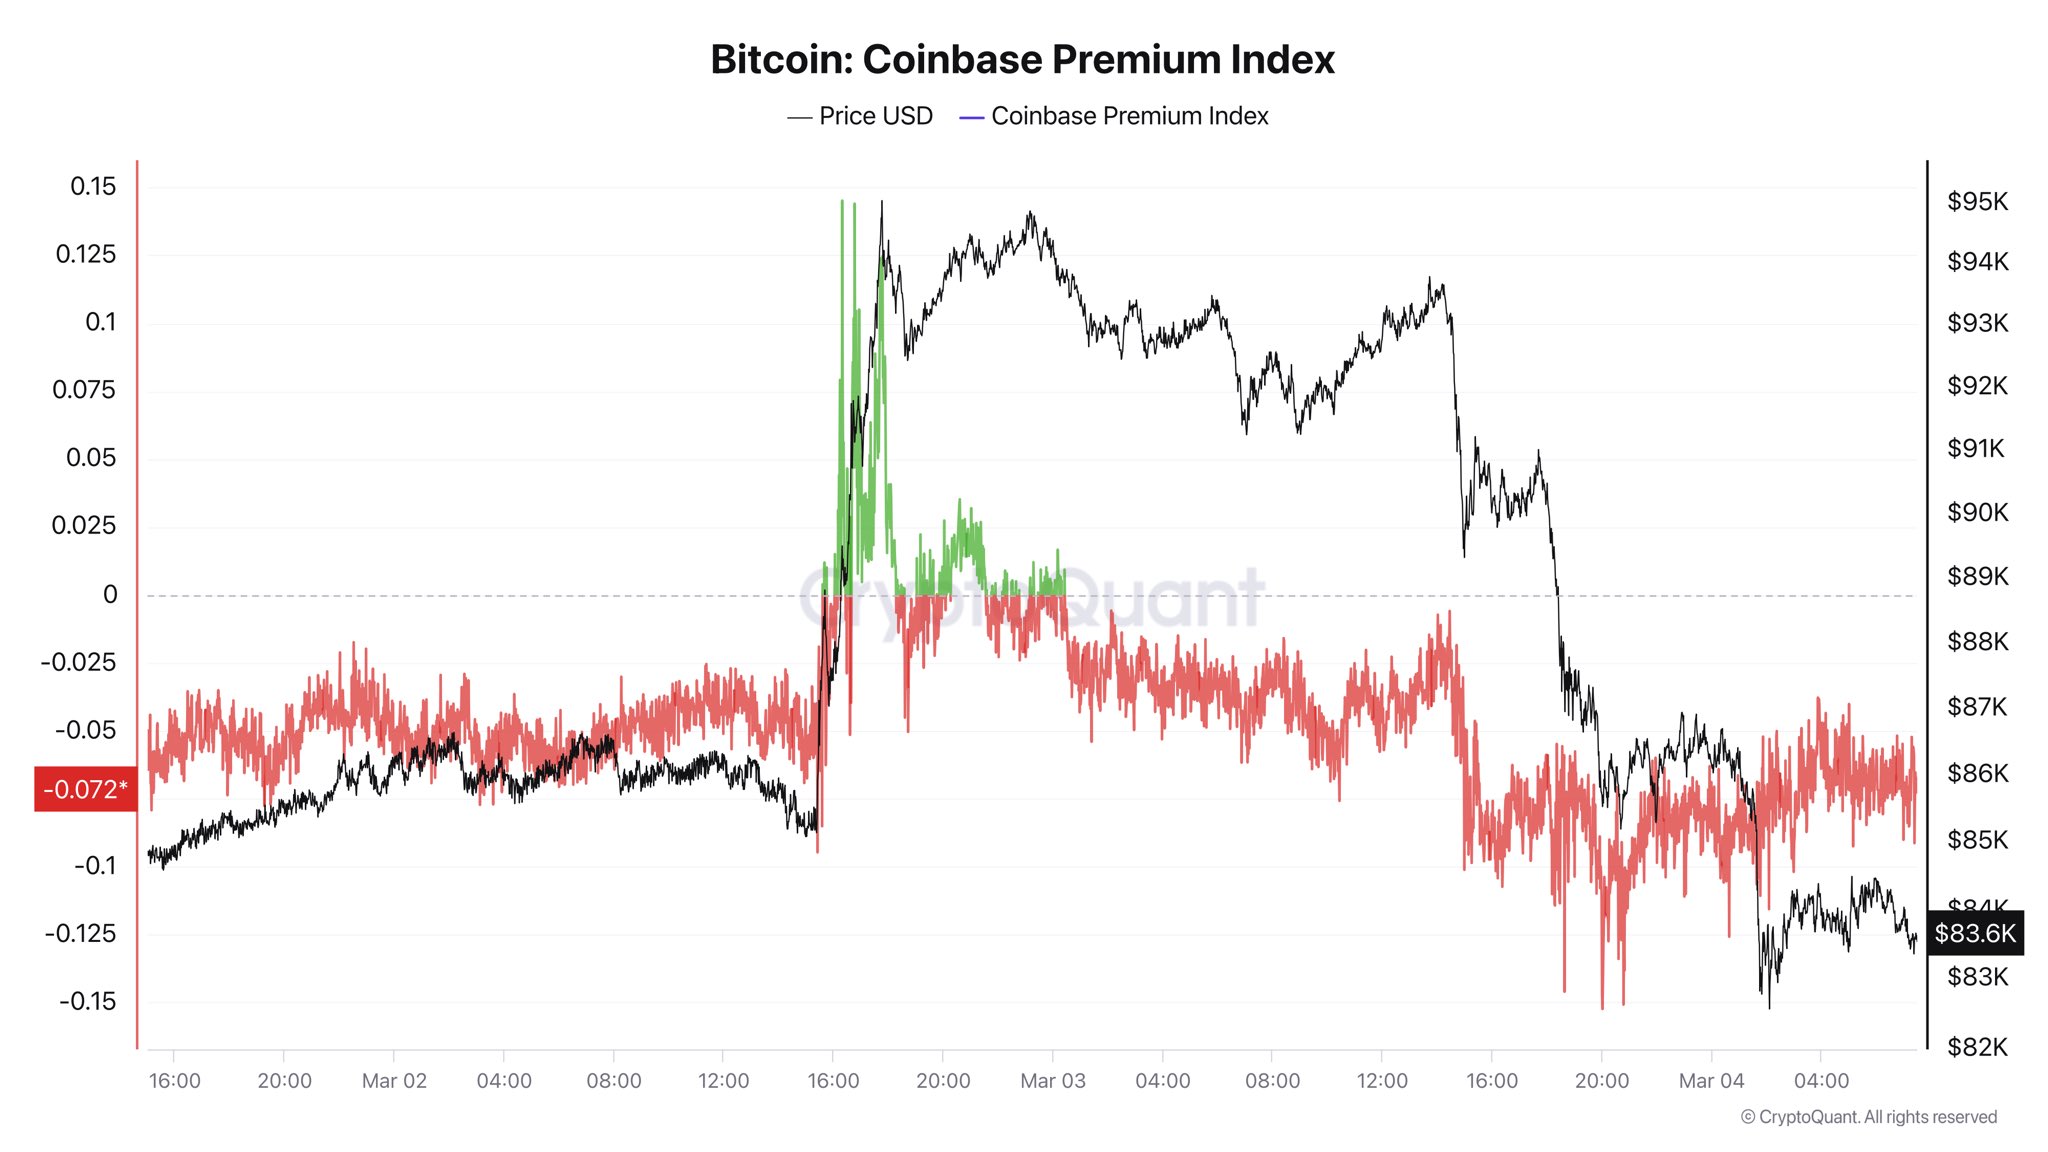
In some other news, sentiment among the US investors has plummeted recently, as CryptoQuant founder and CEO Ki Young Ju has revealed in an X post.

In the chart, the data of the “Coinbase Premium Index” is displayed. This metric measures the difference between the Bitcoin price listed on Coinbase (USD pair) and that on Binance (USDT pair).
The former platform is mainly used by American investors, while the latter serves a global traffic, so the indicator’s value essentially tells us about how the behavior differs between the two demographics.
During the rally earlier, the Bitcoin Coinbase Premium Index spiked to a sharp positive level, suggesting the US-based whales were buying. Shortly after, though, it dipped back into the negative and has since plunged deeper into the zone, implying users on the exchange are doing some heavy distribution.
“Bitcoin market will likely remain slow until sentiment in the U.S. improves,” notes the CryptoQuant founder.
BTC Price
At the time of writing, Bitcoin is floating around $85,700, down more than 4% over the last 24 hours.
Read More

Bitcoin Rallies as Crypto Market Shows Resilience
Bitcoin’s Next Stop: $75,500? Analyst Reveals Historical ‘Magnet’ Level

An analyst has pointed out how the 50-week moving average (MA) of Bitcoin has historically acted as a sort of magnet for the asset’s price.
50-Week MA Is Currently Situated At $75,500 For Bitcoin
In a new post on X, analyst Ali Martinez has discussed about the 50-week MA of Bitcoin. An “MA” is a technical analysis indicator that calculates the average value of any asset’s price over a given period of time and as its name suggests, moves in time, updating its value according to the changes in the price itself.
MAs can be useful tools for studying long-term trends in an asset, as they smooth out the price curve to remove any local deviations. An MA can be taken over any window of time, but there are some particularly popular choices like the 200-day.
In the context of the current topic, the time-range of focus is the 50-week. Here is the chart shared by the analyst, that shows the trend in this MA for Bitcoin over the past decade or so:

As is visible in the above graph, Bitcoin has been approaching this line following the latest market downturn. The asset has previously shown several retests of this level over the years.
“The 50-week moving average has historically acted as a magnet for Bitcoin $BTC during trend shifts,” explains Martinez. So far in the current cycle, the line has acted as support for the cryptocurrency, helping prevent the bull run from running out of steam.
At present, the 50-week MA is situated at $75,500. Given the current trajectory of the asset, it’s possible that a retest of the level may end up taking place once more. It only remains to be seen, though, whether the level would again provide support to Bitcoin, or if it would usher in the bear market.
In some other news, sentiment among the US investors has plummeted recently, as CryptoQuant founder and CEO Ki Young Ju has revealed in an X post.

In the chart, the data of the “Coinbase Premium Index” is displayed. This metric measures the difference between the Bitcoin price listed on Coinbase (USD pair) and that on Binance (USDT pair).
The former platform is mainly used by American investors, while the latter serves a global traffic, so the indicator’s value essentially tells us about how the behavior differs between the two demographics.
During the rally earlier, the Bitcoin Coinbase Premium Index spiked to a sharp positive level, suggesting the US-based whales were buying. Shortly after, though, it dipped back into the negative and has since plunged deeper into the zone, implying users on the exchange are doing some heavy distribution.
“Bitcoin market will likely remain slow until sentiment in the U.S. improves,” notes the CryptoQuant founder.
BTC Price
At the time of writing, Bitcoin is floating around $85,700, down more than 4% over the last 24 hours.
Read More

