Analysts Suggest Bullish Case for DOGE Price, $0.30 Ahead?
Coinspeaker
Analysts Suggest Bullish Case for DOGE Price, $0.30 Ahead?
Dogecoin DOGE $0.18 24h volatility: 5.1% Market cap: $27.07 B Vol. 24h: $1.05 B has jumped nearly 5% in the past 24 hours to trade around $0.18. The memecoin’s recent surge has added over $2.2 billion to its market capitalization in just two days, now sitting at $26.88 billion.
The rally comes amid the broader crypto market uplift following the US Federal Reserve’s decision to keep interest rates unchanged.
Analysts on X have noted that DOGE witnessed a 114% climb from peak to peak in its last two major moves. With its local high sitting at $0.46 back in December 2024, some bulls now speculate a potential 500% breakout that could send the token to $1.
DOGE Price Outlook
DOGE popularity has recently seen a rise in its popularity due to DOGE ETF filings by asset managers such as 21Shares and Osprey Funds.
On the daily chart, Dogecoin appears to have formed a falling wedge pattern since early February. The breakout seems to be occurring near $0.18, and given that the wedge’s widest point spans the $0.35 to $0.40 range, this could project a target between $0.53 and $0.58.
The MACD on the 4-hour chart supports the bullish case. It has just flipped positive, with the MACD line crossing above the signal line. A clear uptick in histogram bars further confirms the bullish bias.
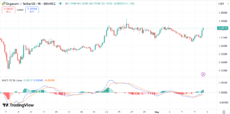
DOGE price chart with MACD | Source: TradingView
Meanwhile, the RSI currently sits around 62, approaching overbought territory. While this reflects strong buying pressure, short-term traders should be cautious, as overheated rallies lead to corrections.
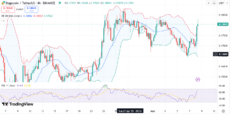
DOGE price chart with RSI and Bollinger Bands | Source: TradingView
Bollinger Bands show DOGE price breaking above the upper band, suggesting potential overextension. If the price holds sustainably above the band with increasing volume, it could signal strength. However, a re-entry into the bands could result in a short-term retracement.
Meanwhile, popular crypto analyst Ali Martinez recently noted a trendline on the DOGE weekly price chart since November 2023. He predicts a potential rebound to $0.30, given the meme coin dips to $0.14.
This trendline has supported #Dogecoin $DOGE since October 2024. A dip to $0.14 could present a buying opportunity ahead of a potential rebound to $0.30.
Join me in this trade by signing up to @coinexcom using my referral link https://t.co/73n8mW9Y5p pic.twitter.com/lD9kr4BJOL
— Ali (@ali_charts) May 7, 2025
Traders could see some resistance around $0.20, followed by $0.23 and then the December high at $0.46.
Read More


Analysts Suggest Bullish Case for DOGE Price, $0.30 Ahead?
Coinspeaker
Analysts Suggest Bullish Case for DOGE Price, $0.30 Ahead?
Dogecoin DOGE $0.18 24h volatility: 5.1% Market cap: $27.07 B Vol. 24h: $1.05 B has jumped nearly 5% in the past 24 hours to trade around $0.18. The memecoin’s recent surge has added over $2.2 billion to its market capitalization in just two days, now sitting at $26.88 billion.
The rally comes amid the broader crypto market uplift following the US Federal Reserve’s decision to keep interest rates unchanged.
Analysts on X have noted that DOGE witnessed a 114% climb from peak to peak in its last two major moves. With its local high sitting at $0.46 back in December 2024, some bulls now speculate a potential 500% breakout that could send the token to $1.
DOGE Price Outlook
DOGE popularity has recently seen a rise in its popularity due to DOGE ETF filings by asset managers such as 21Shares and Osprey Funds.
On the daily chart, Dogecoin appears to have formed a falling wedge pattern since early February. The breakout seems to be occurring near $0.18, and given that the wedge’s widest point spans the $0.35 to $0.40 range, this could project a target between $0.53 and $0.58.
The MACD on the 4-hour chart supports the bullish case. It has just flipped positive, with the MACD line crossing above the signal line. A clear uptick in histogram bars further confirms the bullish bias.
DOGE price chart with MACD | Source: TradingView
Meanwhile, the RSI currently sits around 62, approaching overbought territory. While this reflects strong buying pressure, short-term traders should be cautious, as overheated rallies lead to corrections.
DOGE price chart with RSI and Bollinger Bands | Source: TradingView
Bollinger Bands show DOGE price breaking above the upper band, suggesting potential overextension. If the price holds sustainably above the band with increasing volume, it could signal strength. However, a re-entry into the bands could result in a short-term retracement.
Meanwhile, popular crypto analyst Ali Martinez recently noted a trendline on the DOGE weekly price chart since November 2023. He predicts a potential rebound to $0.30, given the meme coin dips to $0.14.
This trendline has supported #Dogecoin $DOGE since October 2024. A dip to $0.14 could present a buying opportunity ahead of a potential rebound to $0.30.
Join me in this trade by signing up to @coinexcom using my referral link https://t.co/73n8mW9Y5p pic.twitter.com/lD9kr4BJOL
— Ali (@ali_charts) May 7, 2025
Traders could see some resistance around $0.20, followed by $0.23 and then the December high at $0.46.
Read More