Polkadot (DOT) Seen Reversing Losses With 116% Rally To $10 – Analyst

Share:
Predictions Markets
See what traders are focused on

Polkadot token DOT has indeed been hot on the cryptocurrency market throughout the week, appreciating over 21%. Despite the gains bringing further enthusiasm among the investors, the token pressed on higher and continues to trade at $4.65 with a market capitalization of more than $6.6 billion.
Now ranking 17th in the largest cryptocurrencies, investors and DOT aficionados cannot stop wondering if it can sustain its momentum.
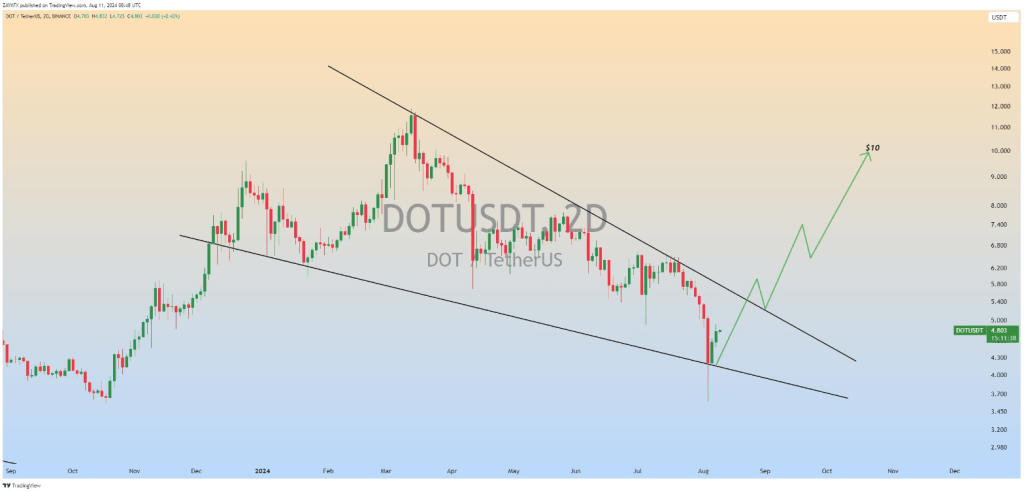
Something is literally now hyping in the air, particularly after the analysis of the popular crypto analyst known as “Zayk Charts.” The analyst observed a falling wedge pattern on the 2-day chart for DOT/USDT, and it could truly be a game-changer.
$DOT Falling Wedge Formation in 2D Timeframe
Incase of Breakout,Next Target wil be $10
#DOT #DOTUSDT #Polkadot #Crypto pic.twitter.com/xgqyjAN4ul
— ZAYK Charts (@ZAYKCharts) August 11, 2024

This is usually a bullish sign and gets more than 70% ripeness for triggering a trend reversal of the negative variety. If DOT breaks out of this wedge, Zayk Charts predicts it could shoot straight up and target a price as high as $10.
Polkadot ‘Greed’ Factor
While the technical analysis looks good for DOT, when we overlay the sentiment, it only makes things more complex. Polkadot’s Fear and Greed Index recently shifted into a “Greed” phase. What does it mean? In plain words, investors are getting excited—maybe a little too excited. The “Greed” phase usually means that it is creating an irrational stage in bullish investors’ minds, where they just think prices are to go up and never go down.
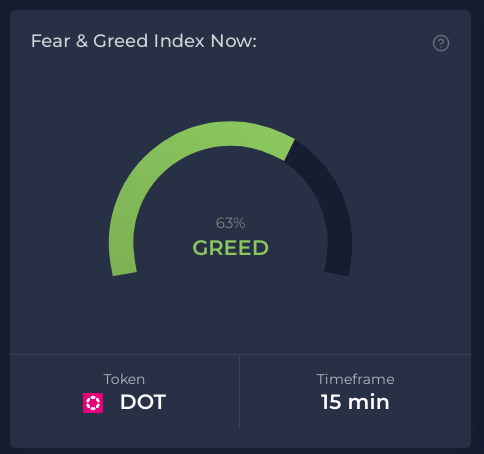
While being great for short-term gains, there’s a catch. Too much greed inflates prices higher than they are truly worth, hence creating a bubble. While the “Greed” period, of course, introduces on the radar screen strong market performance, it also carries with it red flags toward a possible market correction. In short, would we have to face a bubble, or is it just the beginning of an upward long-term trend?
Technical Analysis: Falling Wedge And Breakout Potential
Back to the technical front. The falling wedge pattern is very important, and Zayk Charts marks it accordingly. Technically, this pattern is known to be a bullish reversal pattern. It forms when the price of a coin trades lower but with the rate of decline decreasing, which then results in the formation of a converging trend line. A breakout from this pattern usually results in a massive price increase.
Breaking out of this wedge could be the key to $10 for DOT, which means a 116% increase for the altcoin. That would be a huge comeback for the cryptocurrency, a move that would easily regain investors’ confidence and re-cement Polkadot’s status as a force to reckon within the market. Like any other prediction done in the highly unpredictable world of crypto, however, this also comes with no guarantees.
 Price Forecast And Investor Outlook
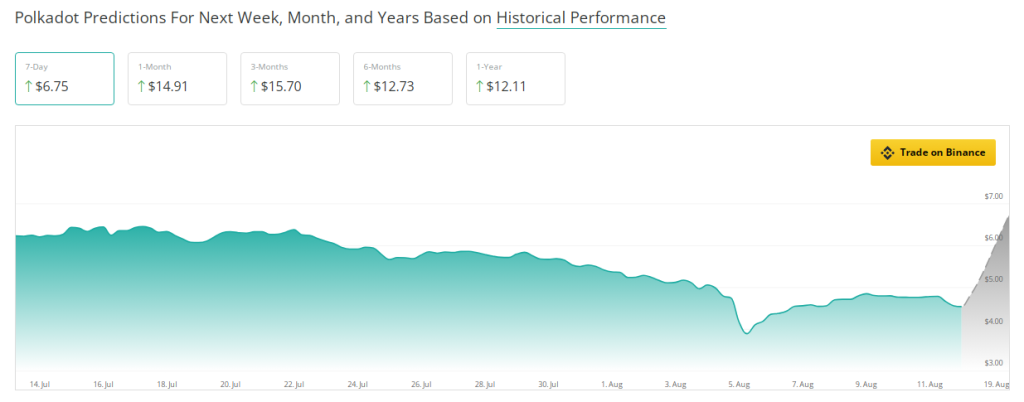
On a broader perspective, DOT still hovers with very positive sentiments. According to data from CoinCheckup, the DOT token is poised for an upsurge in strength. The platform gave a forecast that, in the coming three months, it would climb up by 245%.
Should such an event ensue, this would be a massive comeback for the token. But that’s not all. In the coming six months, Polkadot is projected to climb 180%, and in a one-year time span, it is expected to rise 166%.
Featured image from Host Merchant Services, chart from TradingView


Read More

Analyst: BTC’s 50% Drop Could Be Setting Up a 2017-Style Altcoin Rally
