Can This Intricate XRP Chart Predict a Massive Breakout? Analyst Weighs In

Share:
Predictions Markets
See what traders are focused on

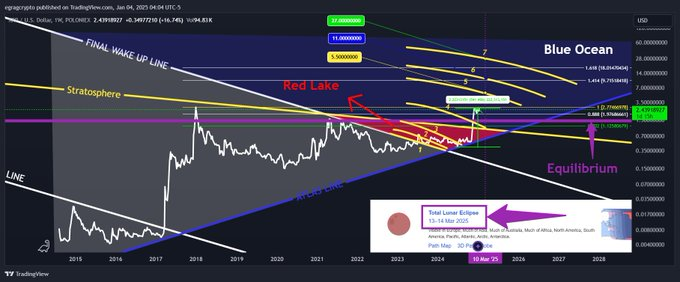
- Analyst’s chart uses Fibonacci arcs to map XRP’s potential price path
- “Red Lake” and “Blue Ocean” zones on the chart represent market behavior
- Technical analysis suggests XRP to potentially reach price targets ranging from $13 to $27
Crypto analyst EGRAGCrypto has released their latest “XRP Bermuda Triangle” chart, presenting a detailed technical analysis that combines Fibonacci arcs and symbolic zones to project XRP’s future price movements.
The chart tracks XRP’s progression through seven significant Fibonacci arcs. As of January 2025, XRP has moved past the first four arcs, indicating a change in market momentum. Price is now navigating between arcs five and seven, with each arc potentially acting as a resistance or acceleration area. The month of March is crucial when these arcs converge, suggesting increased volatility.
Related: XRP’s Counter-Narrative: Challenging Bitcoin’s Institutional Dominance Towards $200K
What Do the “Red Lake” and “Blue Ocean” Zones Signify for XRP?
The Bermuda Triangle structure incorporates symbolic zones that reflect the psychology of XRP traders and overall market sentiment.
…The post Can This Intricate XRP Chart Predict a Massive Breakout? Analyst Weighs In appeared first on Coin Edition.
In This News
Coins

$ 64.15K
+1.62%
$ 1.11
+1.05%
$ 0.00729
+2.67%
$ 0.0000824

$ 0.00132


Predictions Markets
See what traders are focused on
Share:
In This News
Coins
$ 64.15K
+1.62%$ 1.11
+1.05%$ 0.00729
+2.67%$ 0.0000824
$ 0.00132
Predictions Markets
See what traders are focused on
Share:
Read More

Bitcoin Rises Despite U.S.-Iran Tensions—What’s Next for BTC, XRP, and Other Altcoins?
