Fartcoin Drops 9% Breaking Critical Technical Support Zones

Share:
Predictions Markets
See what traders are focused on

- Fartcoin is encountering strong bearish pressure, broken below the 50-day EMA mark.
- The memecoin is down by 9% in the last 24 hours as sellers are dominating the technical chart.
The recent price action of Fartcoin paints a worrying technical outlook, and the cryptocurrency has been facing a lot of bearish pressure, which has led to the breach of several key support levels. As per CMC data, the token is currently trading at $1.3245, with an intraday drop of 9% showing bearishness. The analysis has shown signs of weakness that are not limited to the normal market corrections, which is a sign of structural problems in the price discovery mechanism.
The biggest technical change in Fartcoin is the resolute break below the 50-day exponential moving average (EMA) at $1.1010. This violation is especially worrying because the 50-day EMA is a dynamic support level in healthy uptrends for Fartcoin. The decline beneath this major technical indicator is indicative of the fact that the intermediate-term bullish momentum has been breached, and it may provide the possibility of a protracted decline.
To the bearish storyline, Fartcoin has not been able to hold the psychologically significant support level of $1.00. Psychological price levels, such as round numbers, can be major support and resistance levels because they are prominent in the psychology of traders. When this level is breached, it means that there is increased selling pressure, and market participants are probably becoming risk-averse to the asset.
What’s Next For Fartcoin Price?
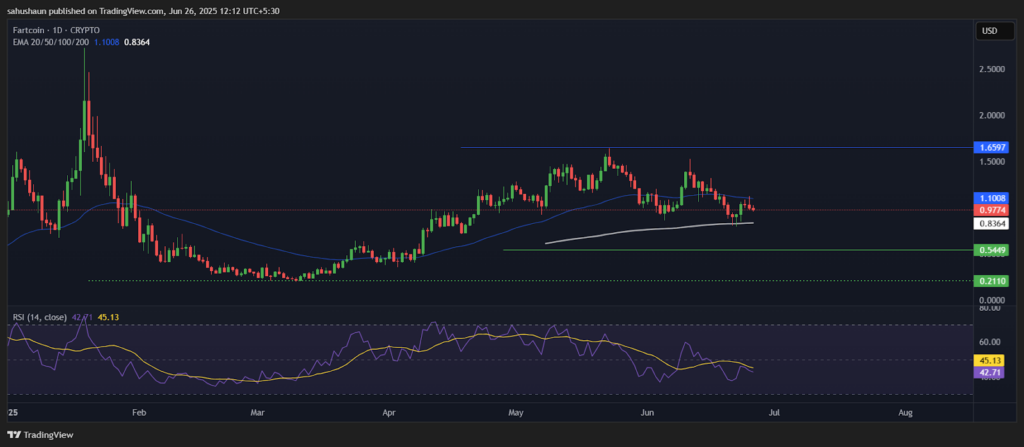
The MACD indicator indicates weakening momentum, as the histogram has a continuous negative value and the MACD line is below the signal line. Such a bearish divergence indicates that the downward trend is likely to persist in the short term. In the same manner, the RSI level of 45.13 shows that the asset is not oversold, but it can still fall further to become technically oversold.
In support and resistance terms, the nearest resistance is at the price of $1.1011, where the 50-day EMA has been broken. This level is now anticipated to serve as dynamic resistance, and any recovery efforts will be difficult. The bad news is that the next key support level to monitor is the 200-day EMA at $0.8365. In case this level does not hold, Fartcoin may experience a worse drop towards the support zone of $0.5449.
Fartcoin’s general technical design implies that Fartcoin is still in the bearish stage. The upside potential is limited before the coin recovers the essential moving averages and bullish momentum indicators.
Highlighted Crypto News Today:
Will the Onyxcoin (XCN) Rally Continue or Lose Steam Before $0.020?


Read More

5 Altcoins Stand to Gain From Tokenized Stocks, Grayscale Says