Chainlink Weekly Indicator Flashes Buy Signal – Can Bulls Hold $13.20 Support?

Share:
Predictions Markets
See what traders are focused on

Chainlink has been under heavy selling pressure, trading in a downtrend as broader market weakness drags crypto prices lower. The entire crypto market remains on the defensive, with macroeconomic uncertainty and escalating trade war fears continuing to shake investor confidence. With no clear resolution in sight, many analysts believe this high-risk environment could persist for the coming months, placing further pressure on digital assets like Chainlink.
LINK has struggled to maintain upward momentum, and market sentiment remains divided. A growing number of analysts are warning of a possible break below current levels, potentially signaling the start of a prolonged bear market cycle. However, not everyone is bearish.
Top crypto analyst Ali Martinez recently shared a more optimistic take. According to his analysis, all eyes should be on the $13.20 support level — a critical trendline that has held strong through recent volatility. Martinez notes that this level could act as the launchpad for a new rebound in LINK’s price. Whether support holds or breaks will likely define Chainlink’s direction in the weeks ahead.
Chainlink Holds Key Support After 55% Drop
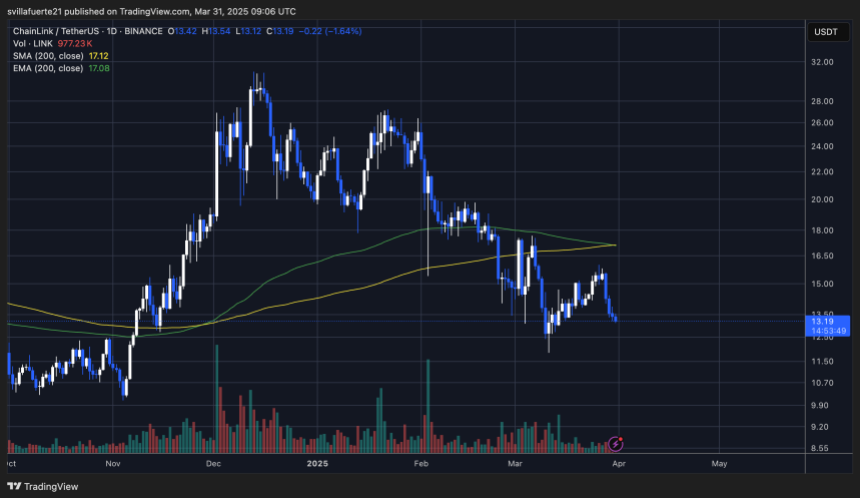
Chainlink is currently down more than 55% from its December high of around $30, struggling to find momentum as broader market conditions remain uncertain. Bulls have yet to reclaim any meaningful resistance levels, and price action has remained underwhelming amid ongoing selling pressure. Still, despite the weakness, bears have been unable to push LINK below the current demand zone — a sign that this area may be acting as a strong support floor.
If this level holds, a significant recovery could be on the horizon. The potential for a rebound is gaining attention, especially as macroeconomic uncertainty clouds the outlook. U.S. President Donald Trump’s latest tariff announcements and geopolitical moves are shaking financial markets, adding pressure to global economies and setting the stage for a potentially volatile era ahead. Crypto markets, often sensitive to global instability, remain caught in the middle.
Amid this backdrop, Martinez has highlighted a key technical level to watch: $13.20. According to Martinez, this support trendline could be the launchpad for the next major rebound in Chainlink’s price. Notably, the TD Sequential indicator has also flashed a buy signal at this level, further strengthening the bullish case for a turnaround.

While risks remain high, a strong defense of the $13.20 zone could trigger renewed momentum and offer bulls the chance to reclaim higher ground. The coming days will be crucial in determining whether LINK can stabilize and rally — or if the current support will finally give way to further downside.
LINK Trades At $13.20 As Price Tests Critical Support
Chainlink (LINK) is trading at $13.20 after enduring several days of intense selling pressure, placing the token in a crucial position. This level now acts as the last strong support before deeper losses, and bulls must hold above it to prevent a breakdown in market structure. A decisive defense here is essential, as slipping below the $13 mark could quickly lead to a drop beneath $12, dragging LINK into lower demand zones.
To shift momentum and spark a recovery rally, bulls need to reclaim higher ground — starting with a move above the $16 level. This zone has acted as a key resistance barrier in recent weeks, and a clean breakout would mark a meaningful shift in sentiment.
More importantly, a sustained push above $17 would bring LINK back above its 200-day moving average (MA) and exponential moving average (EMA), two critical technical indicators that signal broader trend strength. Reclaiming these levels would confirm renewed bullish momentum and could attract fresh demand from sidelined traders and investors.
For now, all eyes remain on the $13 level. Whether bulls defend it or not could determine LINK’s short-term fate — and set the tone for its next major move.
Featured image from Dall-E, chart from TradingView
In This News
Coins

$ 1.82K
+1.93%
$ 0.00732
+2.59%
$ 8.09
+2.01%
$ 0.00...361

$ 0.0000145


Predictions Markets
See what traders are focused on
Share:
In This News
Coins
$ 1.82K
+1.93%$ 0.00732
+2.59%$ 8.09
+2.01%$ 0.00...361
$ 0.0000145
Predictions Markets
See what traders are focused on
Share:
Read More

Mantle Secures $2.5B MNT Token Transfers with Chainlink CCIP Migration