


Huge Move Imminent for XRP: Will $0.5 Finally Fall? (Ripple Price Analysis)
Ripple’s price has been fluctuating around the critical support level of $0.47, experiencing minor volatility and sideways movements. This price range has consistently supported XRP, suggesting substantial demand and raising the probability of a mid-term bullish reversal.
XRP Analysis
By Shayan
The Daily Chart
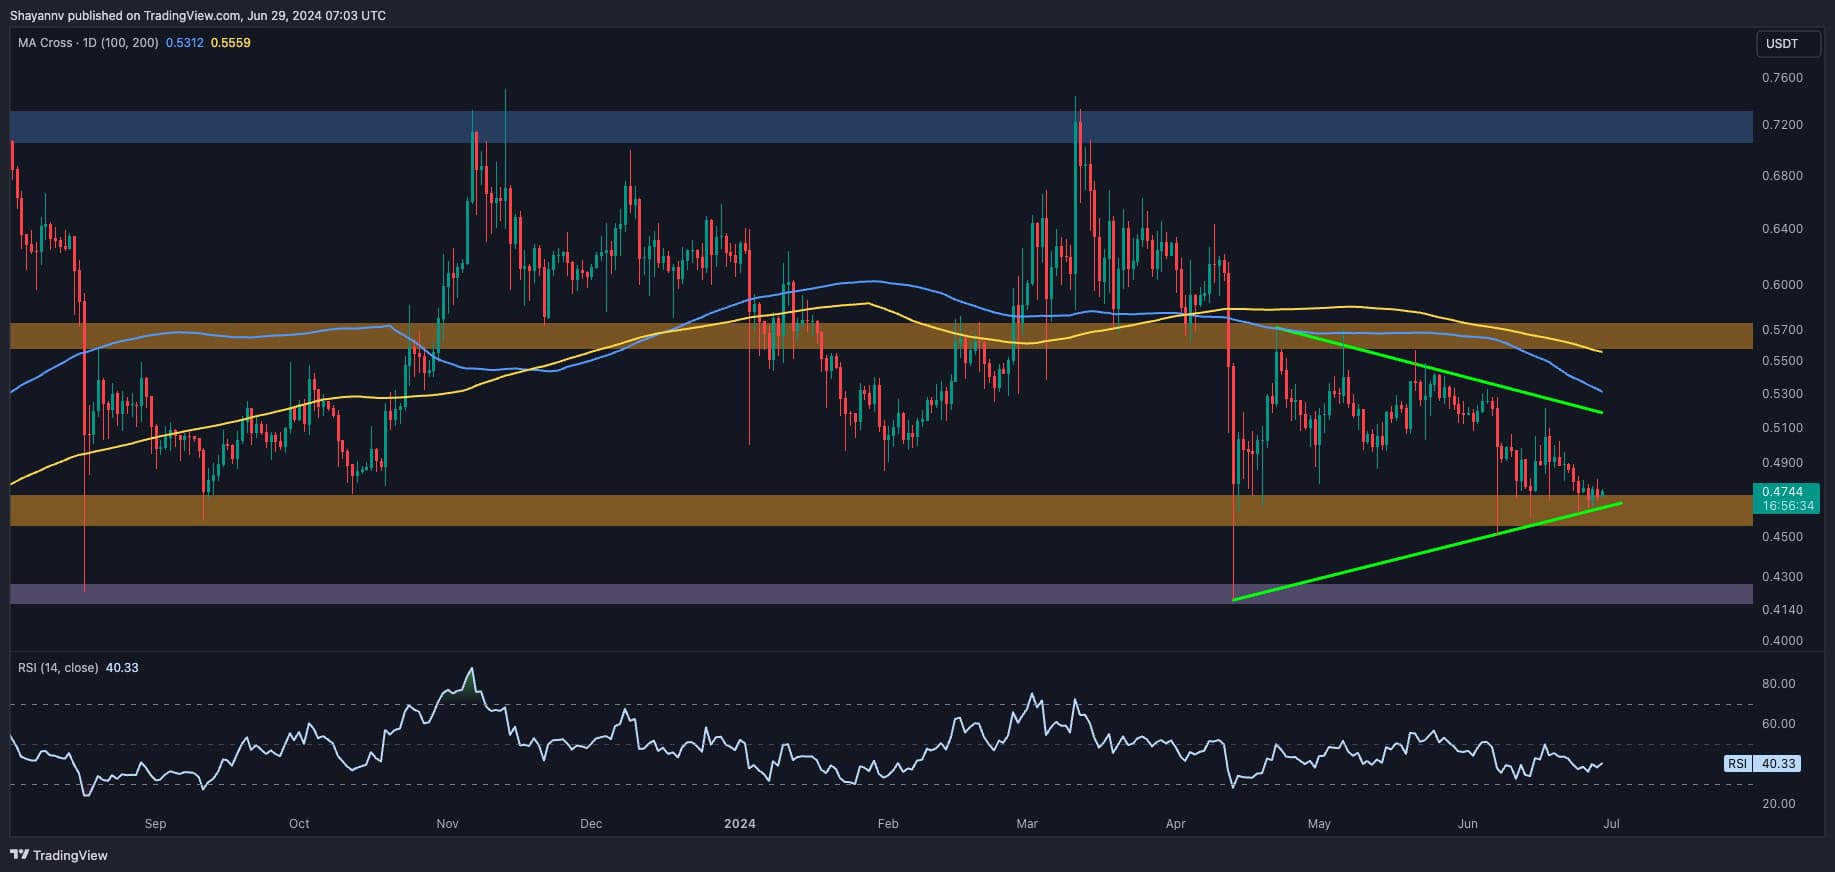
An in-depth look at the daily chart reveals that Ripple has been consolidating within a sideways triangle pattern, signaling a balance between buying and selling pressures and uncertainty about the overall trend direction.
Recently, the price reached the lower boundary of this pattern at $0.47, with sellers struggling to break below this critical threshold.
This range has been in solid support since May 2023, highlighting persistent demand and buying pressure. Consequently, a bullish reversal seems likely in the mid-term, potentially leading to minor bullish movements toward the triangle’s upper boundary.
Conversely, a sudden break below this critical support could trigger significant long-liquidation, causing a sharp decline in the short term.
The 4-Hour Chart
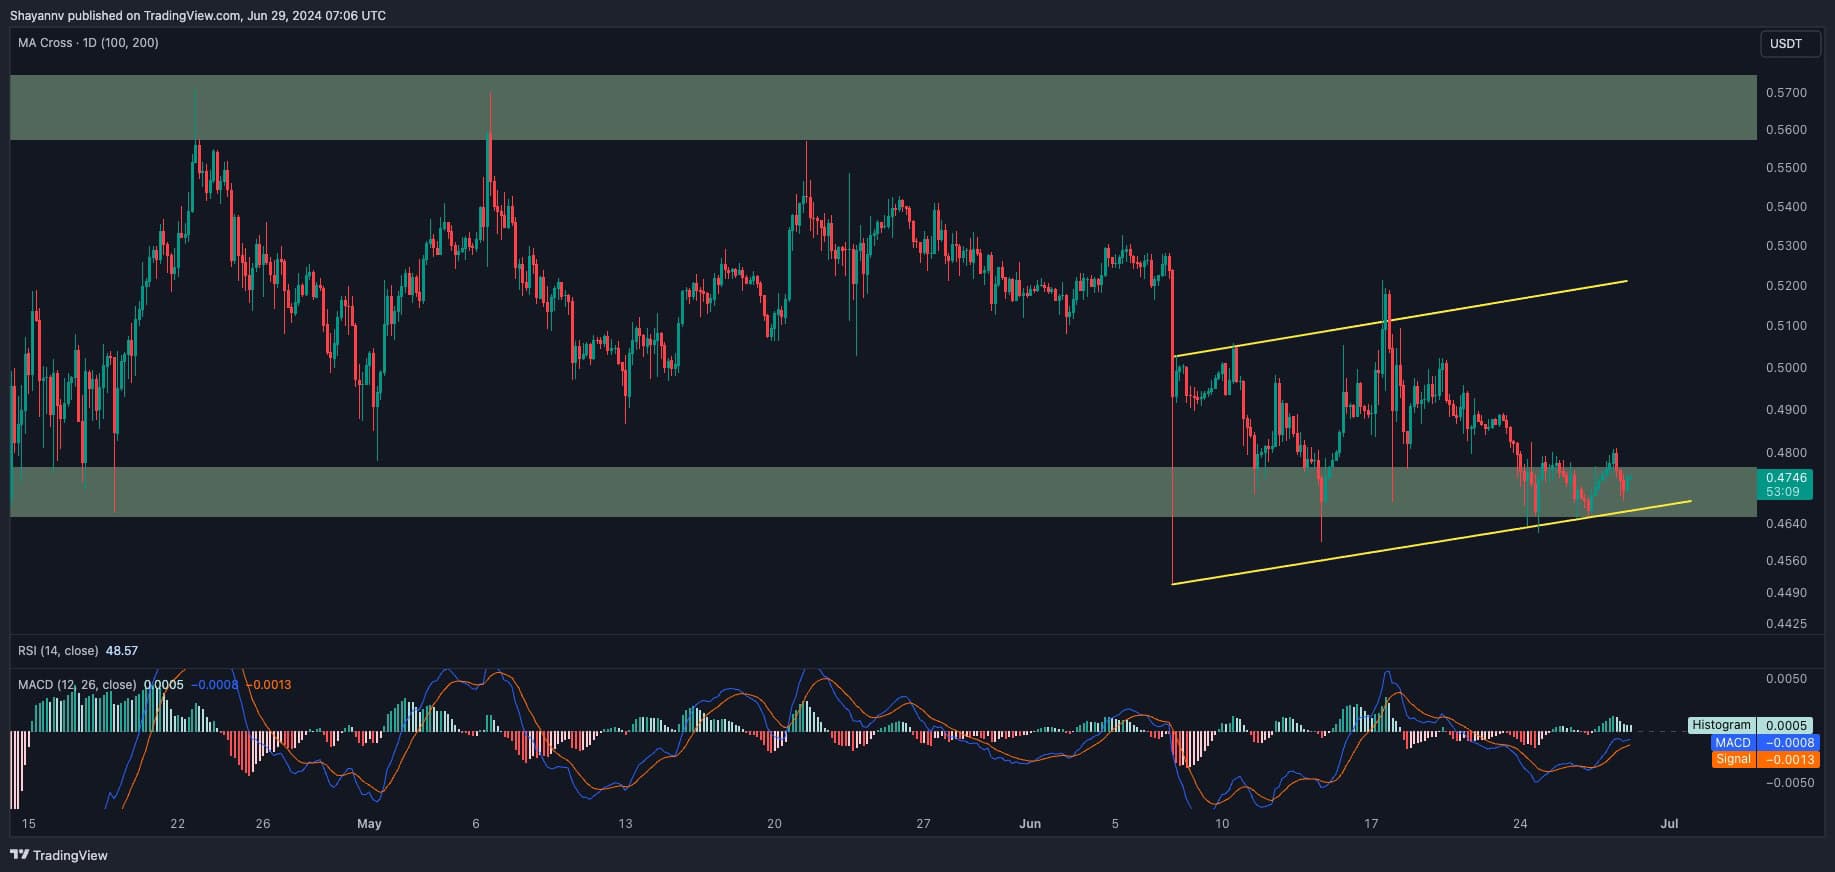
On the 4-hour chart, Ripple exhibits a short phase of lateral movement and uncertain price action around the crucial $0.47 support range, forming a bearish continuation flag pattern.
The price recently dropped to the pattern’s lower trendline and the key $0.47 support area.
If sellers manage to break through this level, a significant and rapid bearish move is anticipated. However, the MACD indicator has recently turned green, indicating a potential bullish rebound. This signal, combined with the prevailing demand near this critical support, suggests increased buying pressure and the likelihood of a mid-term bullish reversal.
The post Huge Move Imminent for XRP: Will $0.5 Finally Fall? (Ripple Price Analysis) appeared first on CryptoPotato.
Read More

Huge Move Imminent for XRP: Will $0.5 Finally Fall? (Ripple Price Analysis)
Ripple’s price has been fluctuating around the critical support level of $0.47, experiencing minor volatility and sideways movements. This price range has consistently supported XRP, suggesting substantial demand and raising the probability of a mid-term bullish reversal.
XRP Analysis
By Shayan
The Daily Chart
An in-depth look at the daily chart reveals that Ripple has been consolidating within a sideways triangle pattern, signaling a balance between buying and selling pressures and uncertainty about the overall trend direction.
Recently, the price reached the lower boundary of this pattern at $0.47, with sellers struggling to break below this critical threshold.
This range has been in solid support since May 2023, highlighting persistent demand and buying pressure. Consequently, a bullish reversal seems likely in the mid-term, potentially leading to minor bullish movements toward the triangle’s upper boundary.
Conversely, a sudden break below this critical support could trigger significant long-liquidation, causing a sharp decline in the short term.
The 4-Hour Chart
On the 4-hour chart, Ripple exhibits a short phase of lateral movement and uncertain price action around the crucial $0.47 support range, forming a bearish continuation flag pattern.
The price recently dropped to the pattern’s lower trendline and the key $0.47 support area.
If sellers manage to break through this level, a significant and rapid bearish move is anticipated. However, the MACD indicator has recently turned green, indicating a potential bullish rebound. This signal, combined with the prevailing demand near this critical support, suggests increased buying pressure and the likelihood of a mid-term bullish reversal.
The post Huge Move Imminent for XRP: Will $0.5 Finally Fall? (Ripple Price Analysis) appeared first on CryptoPotato.
Read More