/
Cryptocurrency News Aggregator
Latest cryptocurrency news, market analytics, and forecasts from leading global publications: CoinDesk, Cointelegraph, BeInCrypto, Watcher.Guru, U.Today and others

Ethereum Foundation AI Agent Research Shows Where Smart Contracts May Be Heading Next
Ethereum Foundation AI Agent Research Shows Where Smart Contracts May Be Heading Next is the kind of crypto story that looks simple at headline lev...
Jul 10, 2026
2 min read
by NewsBTC
Ripple USD supply on Ethereum fell $369 million in 30 days, RLUSD on XRP Ledger overtakes ETH
🔥 RLUSD supply on Ethereum shrank by $369 million in 30 days while the $RLUSD supply on XRP Ledger took the lead.
Continue Reading:Ripple USD supp...
Jul 10, 2026
by COINTURK NEWS

Shiba Inu’s official X account promoted low-cap meme tokens, sparking security concerns
🚨 Shiba Inu’s official X account highlighted third-party meme tokens, raising alarm in the $SHIB community.
Continue Reading:Shiba Inu’s official ...
Jul 10, 2026
by COINTURK NEWS

Cryptocurrency Market Activity: Bitcoin Surpasses $64,000, Whale Activity is High! Here are the Altcoins They’re Trading
As Bitcoin surged above $64,000, whales traded in BTC and altcoins. Which altcoins did the whales trade?
Continue Reading: Cryptocurrency Market ...
Jul 10, 2026
by Bitcoin Sistemi

Kraken Pro Fee Tier Overhaul Targets High-Volume Traders And Exchange Loyalty
Kraken Pro Fee Tier Overhaul Targets High-Volume Traders And Exchange Loyalty is the kind of crypto story that looks simple at headline level but b...
Jul 10, 2026
2 min read
by NewsBTC

U.S. government digital dollar set to be banned tonight under housing law's CBDC limit
Despite President Donald Trump's refusal to sign Congress' bipartisan housing bill, it's set to go into effect at midnight, and its temporary CBDC ...
Jul 10, 2026
by CoinDesk

Spot Bitcoin ETFs Bleed $95M as Ethereum Inflow Streak Snaps
Spot Bitcoin ETFs lost $95.3M on July 9 while Ethereum ETFs snapped a five-day inflow streak with $52M outflows, pointing to cautious institutional...
Jul 10, 2026
3 min read
by BlockchainReporter

Aave V3 On zkSync Era Gives DeFi Lending Another Push Into ZK Rollups
Aave V3 On zkSync Era Gives DeFi Lending Another Push Into ZK Rollups is the kind of crypto story that looks simple at headline level but becomes m...
Jul 10, 2026
2 min read
by NewsBTC

Revolut X added AI assistant support for crypto trading and portfolio management
🧠 Revolut X has introduced AI assistant support for crypto trading and portfolio tracking.
Continue Reading:Revolut X added AI assistant support f...
Jul 10, 2026
by COINTURK NEWS
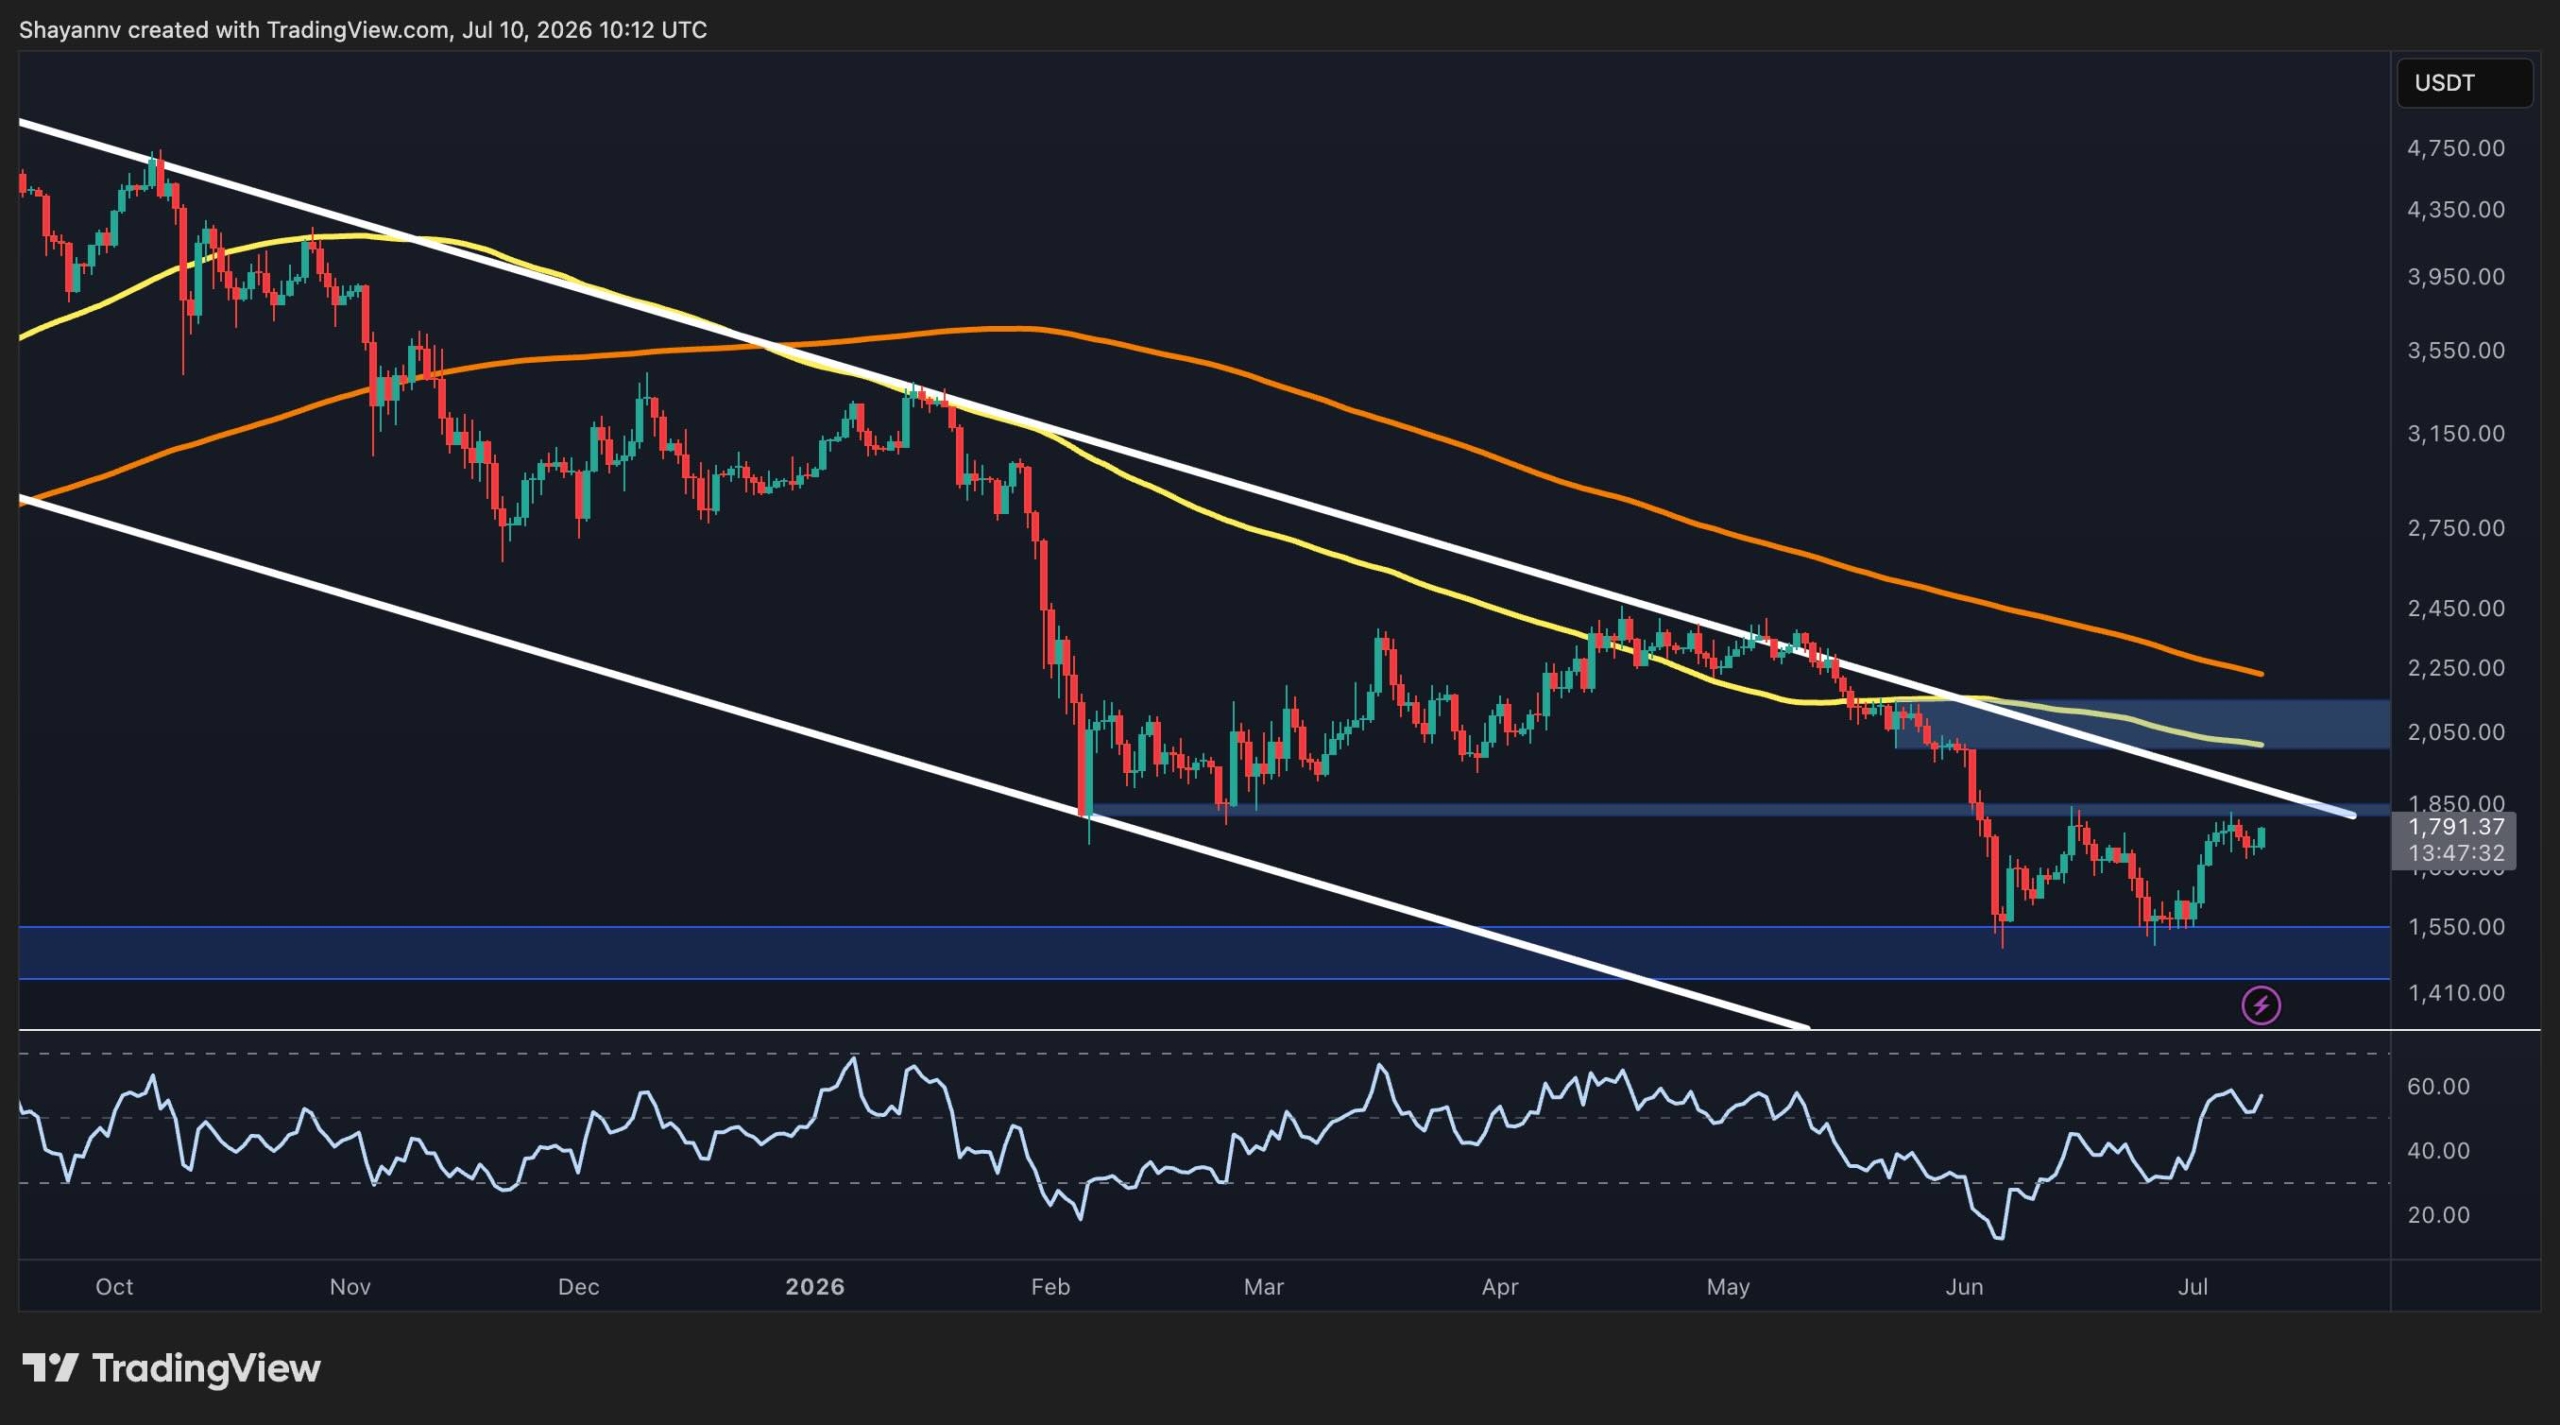
Ethereum Price Analysis: ETH Faces a Crucial Test After Latest Rebound
Ethereum has staged a notable recovery after defending its recent lows, with buyers gradually rebuilding momentum. While the higher time frames rem...
Jul 10, 2026
< 1 min read
by CryptoPotato