Ethereum (ETH) Price Prediction for July 11

Share:
Predictions Markets
See what traders are focused on

After a period of steady accumulation, Ethereum price today has broken above a multi-month symmetrical triangle near $2,780 and is now trading near $2,808. The breakout follows strong volume support and a clean bullish structure on both the daily and 4-hour timeframes.
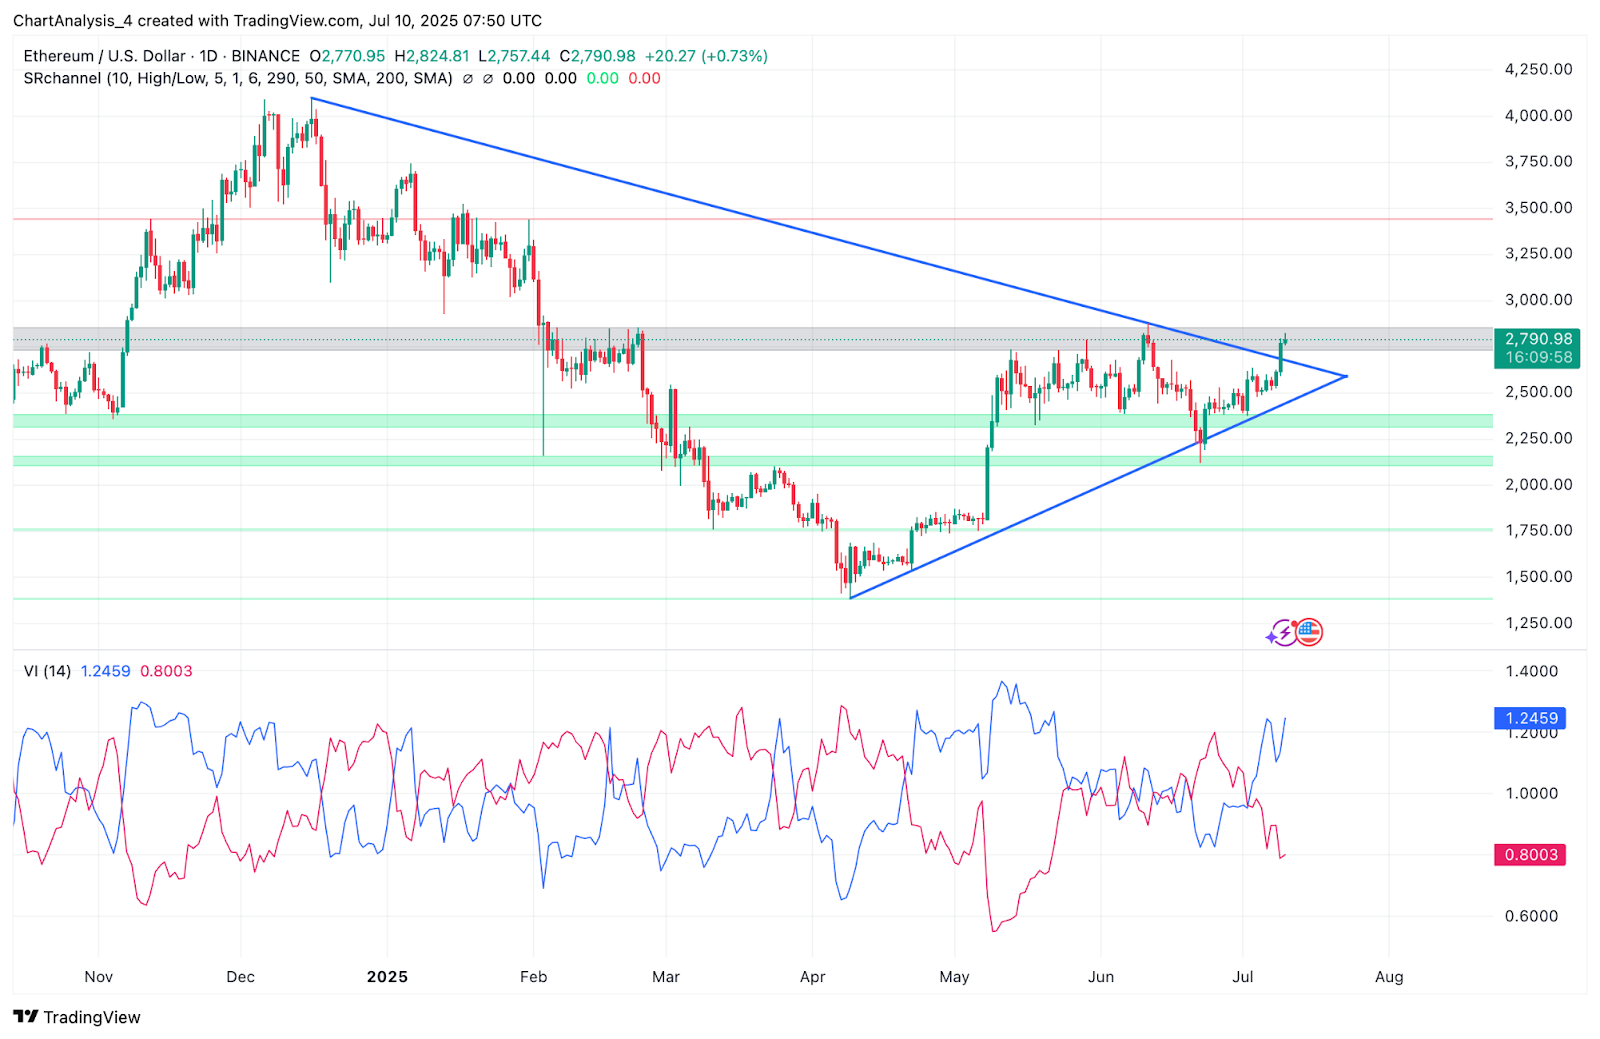
With indicators signaling a fresh momentum wave, ETH appears primed for further upside if $2,800 is flipped into support. Moreover, the Vortex Indicator (VI) on the daily chart shows the blue trend line (VI+) surging to 1.24 while the red line (VI−) fades, indicating bullish trend expansion.
What’s Happening With Ethereum’s Price?
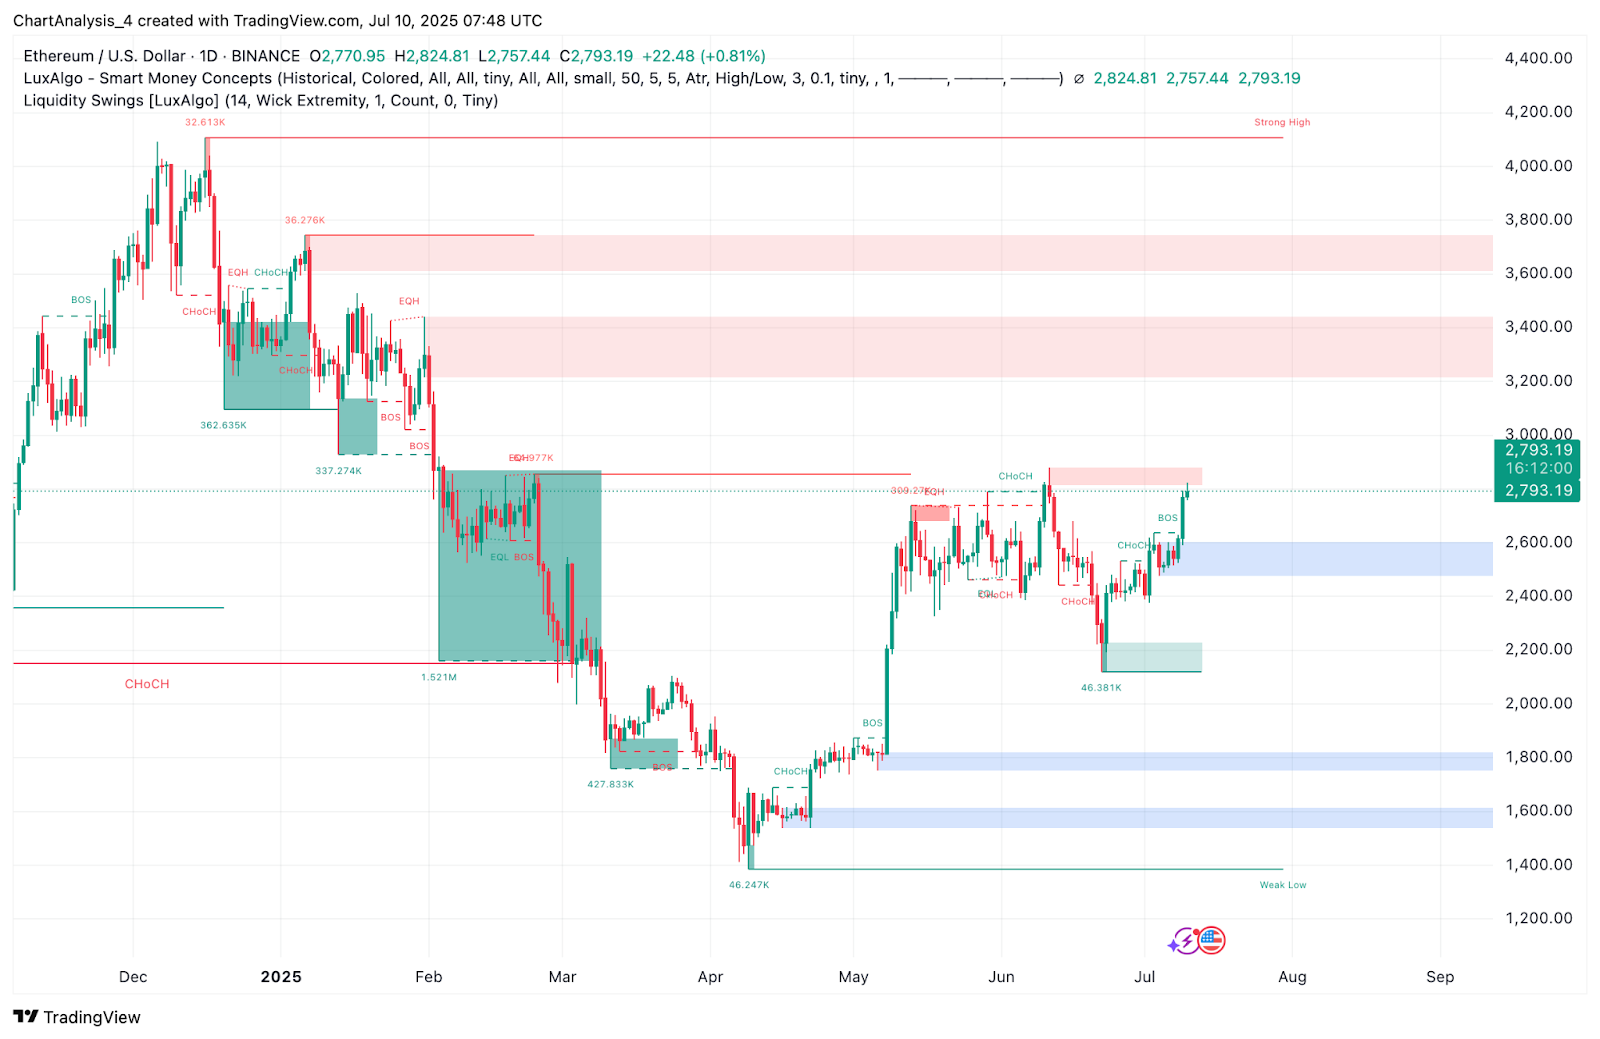
Ethereum price action shows a breakout above a long-term symmetrical triangle that began forming in Q1 2025. On the daily chart, ETH decisively pierced the triangle apex around $2,770 and reclaimed structural resistance at $2,790, backed by a bullish BOS (Break of Structure) confirmation on Smart Money Concepts. This marks Ethereum’s first higher-high breakout since early March.
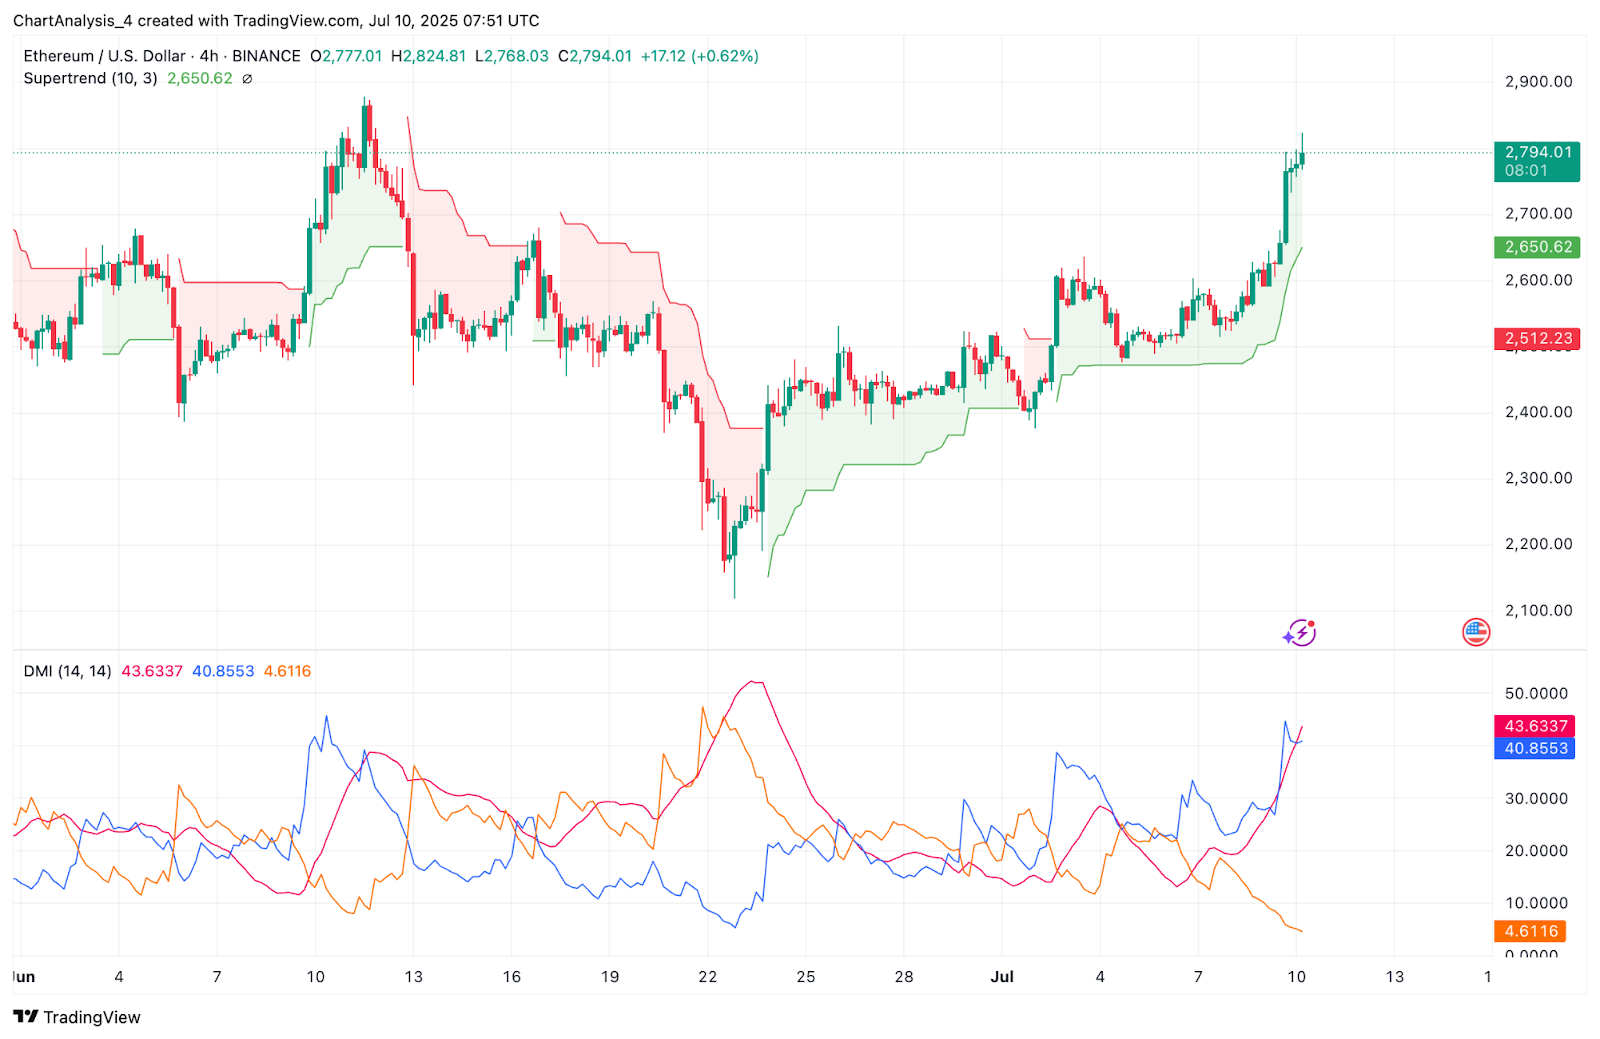
Supporting this move, the 4-hour Supertrend has flipp…
The post Ethereum (ETH) Price Prediction for July 11 appeared first on Coin Edition.


