/
Cryptocurrency News Aggregator
Latest cryptocurrency news, market analytics, and forecasts from leading global publications: CoinDesk, Cointelegraph, BeInCrypto, Watcher.Guru, U.Today and others

Evernorth launches Japanese arm, plans $1 billion Nasdaq debut with SBI backing
🇯🇵 Evernorth enters Japan, targeting $1 billion with a Nasdaq IPO and major SBI investment.
Continue Reading:Evernorth launches Japanese arm, pla...
Jul 12, 2026
by COINTURK NEWS

Watch Out: Massive Token Unlocks Coming for 14 Altcoins This Week—Here’s the Day-by-Day, Hour-by-Hour List
The cryptocurrency market will see a large number of token unlocks across numerous altcoins in the new week.
Continue Reading: Watch Out: Massive...
Jul 12, 2026
by Bitcoin Sistemi

BlackRock’s BUIDL fund doubles on Avalanche, surpasses $900 million in one week
🚨 BlackRock’s BUIDL fund on Avalanche grew to over $900 million after doubling in one week.
Continue Reading:BlackRock’s BUIDL fund doubles on Ava...
Jul 12, 2026
by COINTURK NEWS
Noxa Fi Drives $7.66M in Robinhood Crypto Fees in 7 Days
Noxa Fi generated about $7. 66 million in Robinhood crypto fees over a seven-day period, according to on-chain data tracking activity on the Robinh...
Jul 12, 2026
by CoinCu News

Binance’s Bitcoin reserve ratio falls to all time low as $43 billion in stablecoins sidelines
🚨 Binance’s Bitcoin reserve ratio drops to a record low as $43 billion in stablecoins sit idle.
Continue Reading:Binance’s Bitcoin reserve ratio f...
Jul 12, 2026
by COINTURK NEWS

Watch Out: Lots of Economic Developments and Altcoin Events This Week—Here’s the Day-by-Day, Hour-by-Hour Schedule
The cryptocurrency market is preparing to host numerous economic developments and altcoin events in the new week.
Continue Reading: Watch Out: Lo...
Jul 12, 2026
by Bitcoin Sistemi

South Korea Crypto Volume Hits a Two-Year Low Amid the KOSDAQ Crash
In Brief
South Korea's crypto trading volume hit a two-year low, below 10 trillion won for the first time.
Weekly volume reached roughly 9.97 tri...
Jul 12, 2026
3 min read
by BeInCrypto
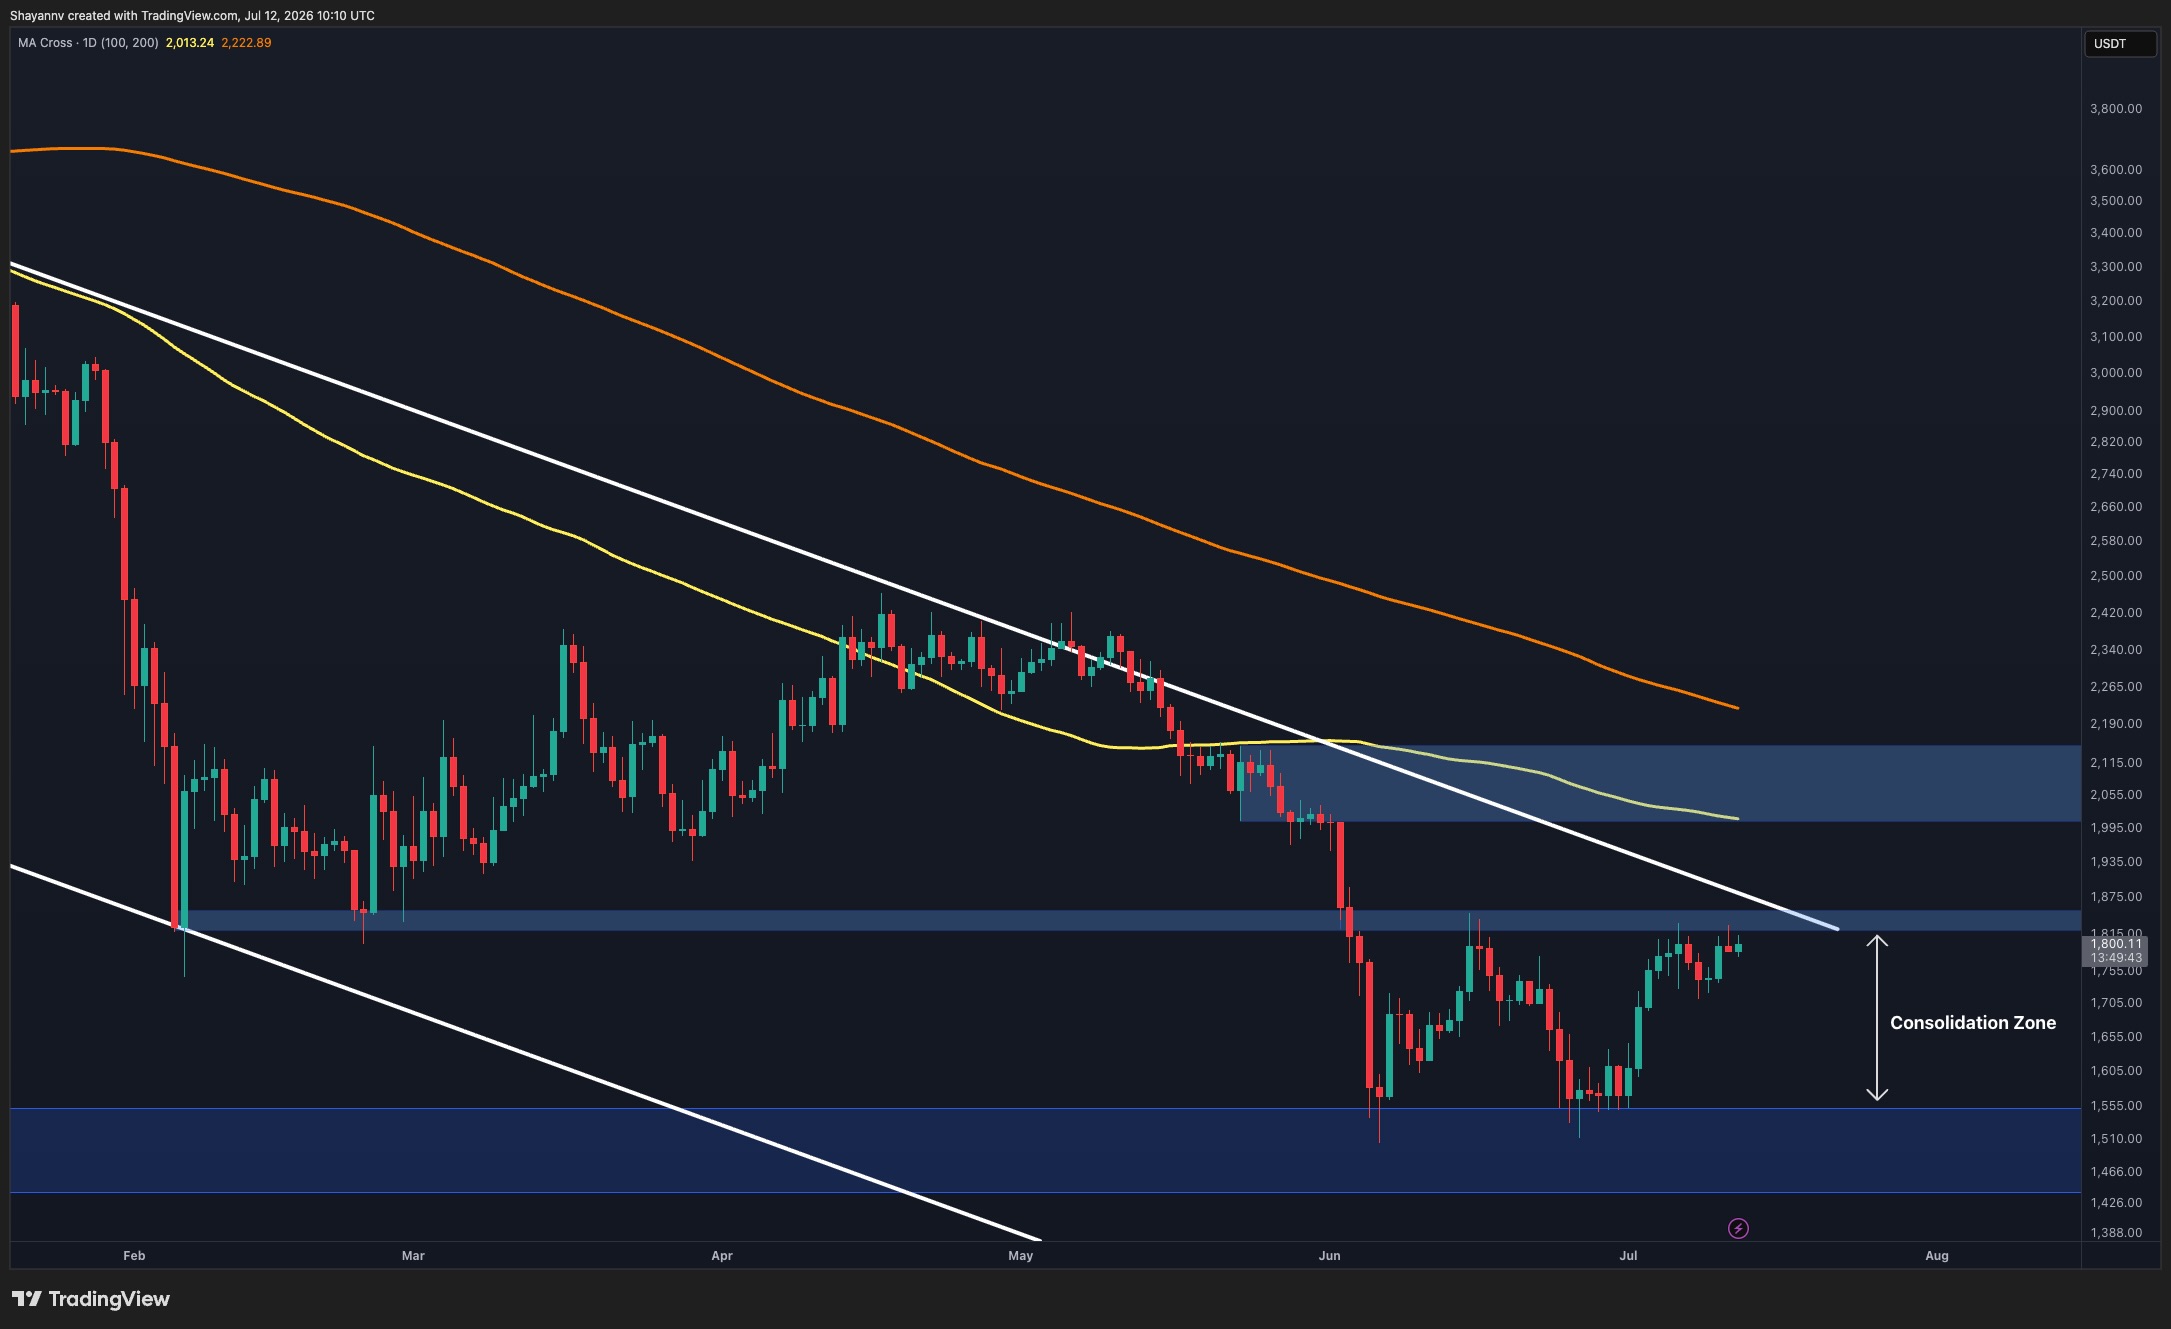
Ethereum Price Analysis: ETH Reaches Its Biggest Obstacle on the Road to $2K
Ethereum has continued its recovery from the June lows and is now approaching a major technical inflection point. While the recent rally has improv...
Jul 12, 2026
< 1 min read
by CryptoPotato

One crypto wallet tied to a 20-year-old fraudster processed over $122M before Interpol closed in
The Thailand case shows how cross-chain token swaps can complicate tracing across services, assets and borders.
The post One crypto wallet tied to ...
Jul 12, 2026
3 min read
by CryptoSlate

Strategy sells $216 million in Bitcoin, shifts stance on “never sell” policy
🟠 Strategy moves $216 million in Bitcoin, changing its longstanding policy.
Continue Reading:Strategy sells $216 million in Bitcoin, shifts stance...
Jul 12, 2026
by COINTURK NEWS