Currencies33045
Market Cap$ 2.80T-0.25%
24h Spot Volume$ 25.75B-27.7%
DominanceBTC60.03%-0.35%ETH6.89%+0.59%
ETH Gas0.32 Gwei
Country flag

English

Cryptorank
 icon
 icon
 icon
 icon
MainNewsBitcoin Prim...

Bitcoin Primed For A Major Rebound Following ‘Final Capitulation,’ Analyst Predicts

Bitcoin Primed For A Major Rebound Following ‘Final Capitulation,’ Analyst Predicts

After surging past $90,000 for the first time on November 12, 2024, Bitcoin (BTC) has been trading within a broad range between $91,000 and $108,000. However, some analysts remain optimistic that BTC is poised to break out of this range to the upside following what they describe as a ‘final capitulation.’

Bitcoin Consolidation Nearing Its End?

Crypto analyst Trader Tardigrade recently shared their analysis of Bitcoin’s price action on X. According to the analyst, BTC might be approaching a final capitulation before experiencing a significant breakout that could end its prolonged range-bound movement. The analyst commented:

The current crypto market sentiment isn’t great. I’d actually welcome a downturn in the next couple of days to complete this price action. Bitcoin experienced a final capitulation at the 27th bar during consolidation in January 2024, just before a massive rebound. If history repeats, the final capitulation level will be reached today or tomorrow. After that, BTC will surge with a massive rebound.

To support their prediction, Trader Tardigrade shared a chart comparing Bitcoin’s current price action with its behavior in January 2024. During that period, BTC consolidated for 53 days, underwent a final capitulation, and then rallied sharply, climbing from around $39,000 to as high as $71,000.

bitcoin

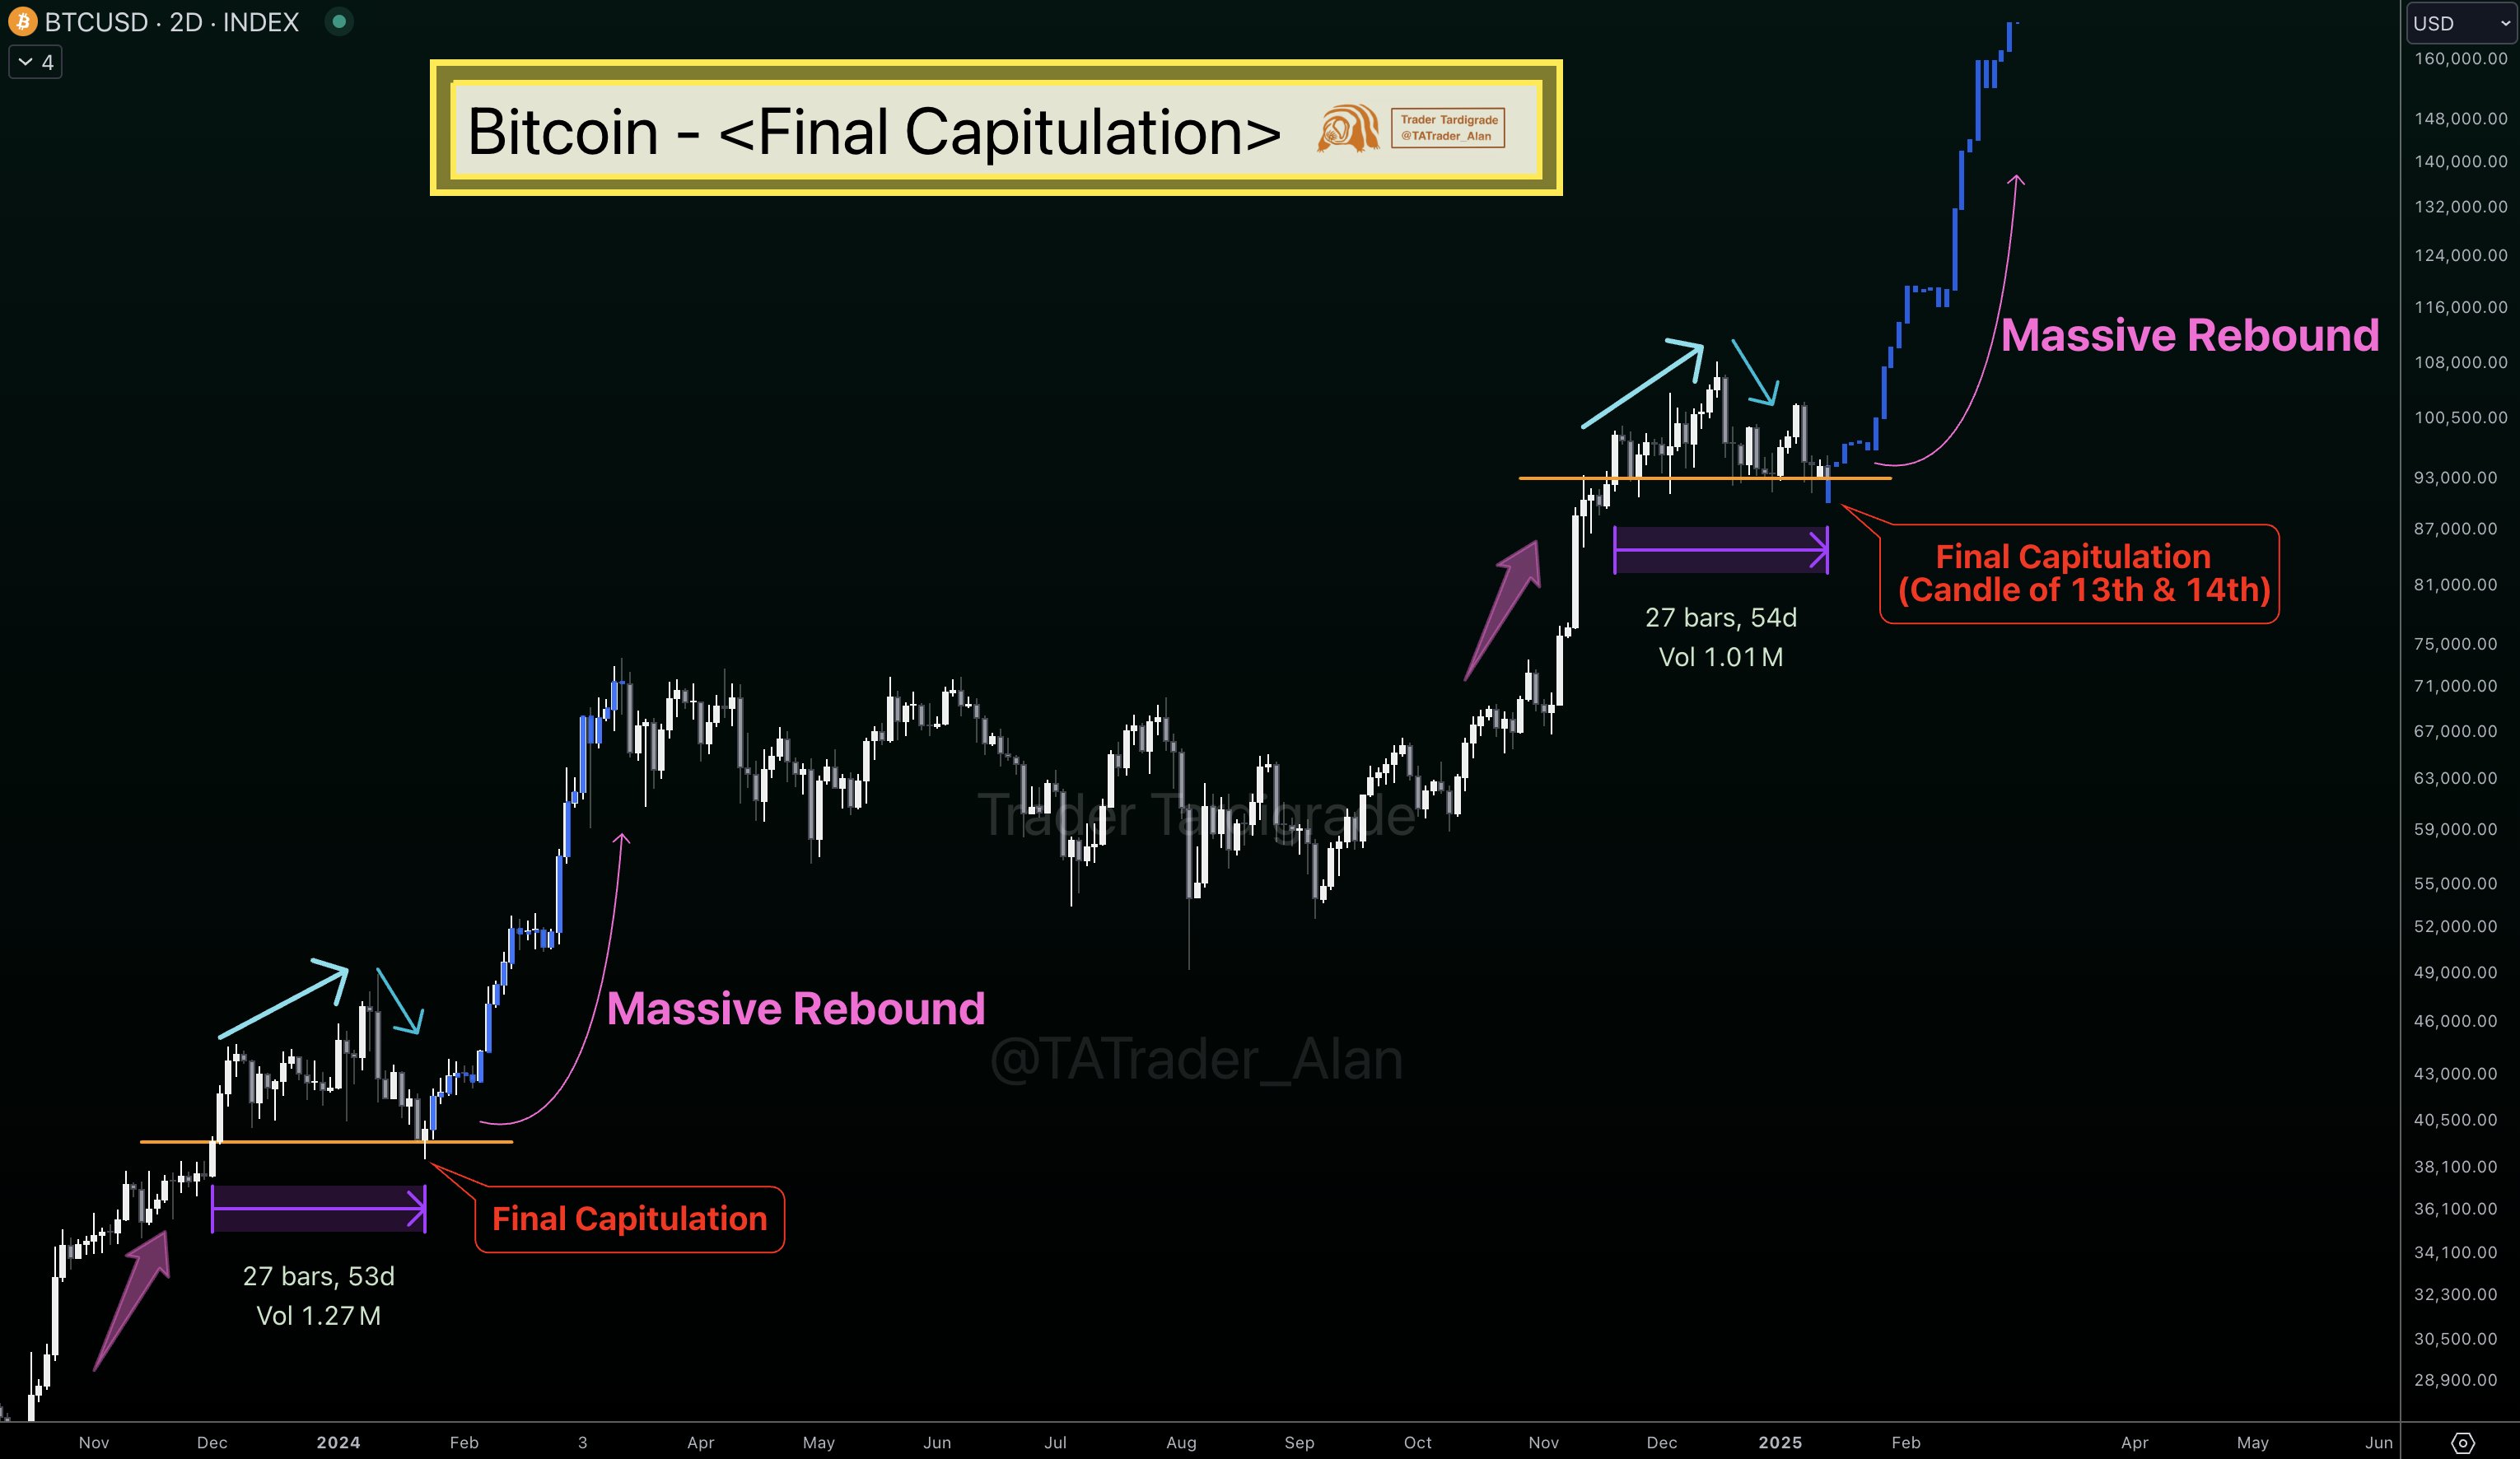
Interestingly, Bitcoin’s current consolidation phase has already lasted over 50 days. If BTC follows its January 2024 pattern, the final capitulation could occur on January 13 or 14.

Another crypto analyst, @CryptosBatman, pointed to tightening Bollinger Bands on Bitcoin’s three-day chart. They highlighted that the Bollinger Bandwidth has reached an extremely oversold level and remarked:

Historically, such lows signal a local bottom. Remarkably, the bandwidth is now tighter than when Bitcoin was at $50K, suggesting the bottom might be very close.

bollinger

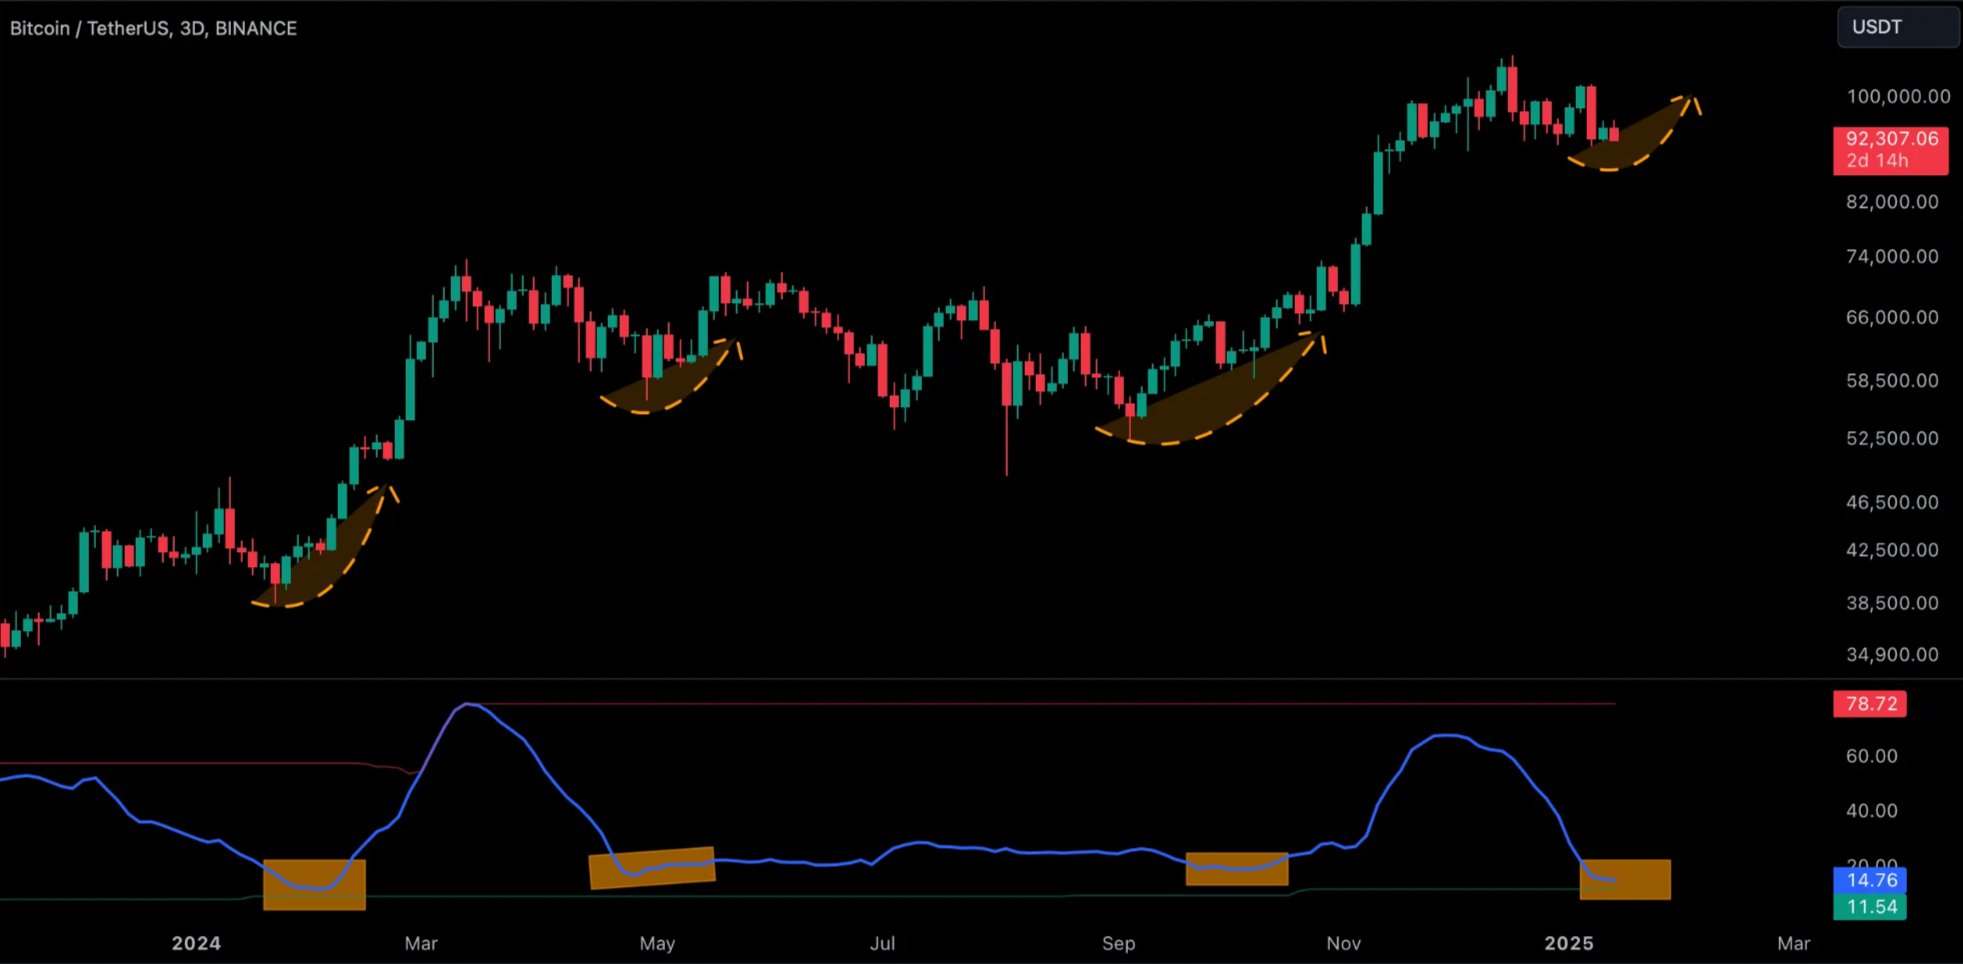
For the uninitiated, Bollinger Bandwidth is a metric derived from Bollinger Bands that measures the distance between the upper and lower bands relative to the moving average. It is often used to identify periods of low volatility, which can signal potential breakout opportunities.

Crypto Analysts Foresee A Positive 2025

While Bitcoin’s ongoing consolidation phase might frustrate bulls, many analysts remain confident that digital assets will benefit from multiple favorable factors in the coming months.

For instance, crypto entrepreneur Arthur Hayes recently predicted that BTC may rally in Q1 2025 on the back of the US Federal Reserve’s (Fed) decision to inject fresh liquidity into the US economy through money printing.

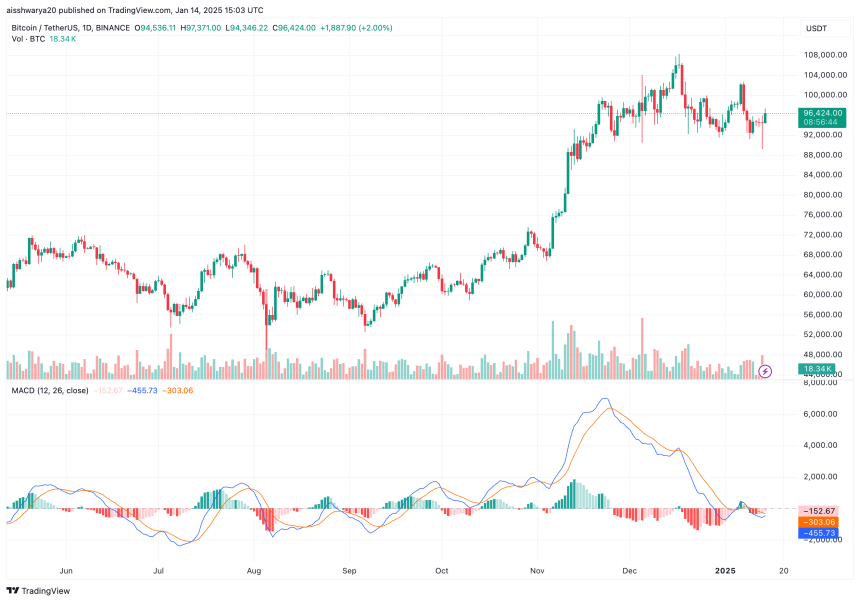
Similarly, crypto analyst Dave The Wave has forecasted that BTC is likely to hit a peak during summer 2025. At press time, BTC trades at $96,424, up 4.9% in the past 24 hours.

bitcoin
Read the article at NewsBTC

Read More

Bitcoin Enters Oversold Levels, Analyst Warns This Is Bearish, Not Bullish

Bitcoin Enters Oversold Levels, Analyst Warns This Is Bearish, Not Bullish

Crypto analyst Quinten recently revealed that Bitcoin has entered oversold levels. Ho...
Apr, 18, 2025
2 min read
by NewsBTC
‘We Shouldn’t Be Tapping Out Just Yet’: Guy Turner Says Crypto Bear Market Not Starting Soon – Here’s His Outlook

‘We Shouldn’t Be Tapping Out Just Yet’: Guy Turner Says Crypto Bear Market Not Starting Soon – Here’s His Outlook

A widely followed crypto analyst says that investors should continue hanging on as we...
Apr, 18, 2025
2 min read
by The Daily Hodl
MainNewsEthereum Pri...

Ethereum Price Power Play: Can It Smash Through Key Hurdles?


Jan, 15, 2025
2 min read
by Aayush Jindal
for NewsBTC
Ethereum Price Power Play: Can It Smash Through Key Hurdles?

Ethereum price started a minor recovery wave above the $3,120 zone. ETH is rising and facing hurdles near the $3,240 zone.

  • Ethereum started a minor recovery wave above the $3,120 zone.
  • The price is trading above $3,200 and the 100-hourly Simple Moving Average.
  • There is a short-term contracting triangle forming with resistance at $3,240 on the hourly chart of ETH/USD (data feed via Kraken).
  • The pair could struggle to start a fresh increase above the $3,240 resistance level.

Ethereum Price Aims Higher

Ethereum price started a recovery wave above the $3,050 level like Bitcoin. ETH was able to clear the $3,080 and $3,120 resistance levels to move into a short-term positive zone.

The price even cleared the 50% Fib retracement level of the downward move from the $3,334 swing high to the $2,920 low. However, the bears are active near the $3,220 and $3,240 levels. There is also a short-term contracting triangle forming with resistance at $3,240 on the hourly chart of ETH/USD.

Ethereum price is now trading just above $3,200 and the 100-hourly Simple Moving Average. On the upside, the price seems to be facing hurdles near the $3,230 level. It is near the 76.4% Fib retracement level of the downward move from the $3,334 swing high to the $2,920 low. The first major resistance is near the $3,240 level.

Ethereum Price

The main resistance is now forming near $3,330. A clear move above the $3,330 resistance might send the price toward the $3,450 resistance. An upside break above the $3,450 resistance might call for more gains in the coming sessions. In the stated case, Ether could rise toward the $3,500 resistance zone or even $3,550 in the near term.

Another Decline In ETH?

If Ethereum fails to clear the $3,240 resistance, it could start another decline. Initial support on the downside is near the $3,180 level. The first major support sits near the $3,120.

A clear move below the $3,120 support might push the price toward the $3,050 support. Any more losses might send the price toward the $3,020 support level in the near term. The next key support sits at $2,920.

Technical Indicators

Hourly MACDThe MACD for ETH/USD is losing momentum in the bullish zone.

Hourly RSIThe RSI for ETH/USD is now above the 50 zone.

Major Support Level – $3,120

Major Resistance Level – $3,240

Read the article at NewsBTC

Read More

Crypto Price Analysis April-18: ETH, XRP, ADA, SOL, and HYPE

Crypto Price Analysis April-18: ETH, XRP, ADA, SOL, and HYPE

This week, we examine Ethereum, Ripple, Cardano, Solana, and Hype in greater detail. ...
Apr, 18, 2025
3 min read
by CryptoPotato
Ethereum Price Fights for Momentum—Traders Watch Key Resistance

Ethereum Price Fights for Momentum—Traders Watch Key Resistance

Ethereum price started a fresh decline below the $1,620 zone. ETH is now consolidatin...
Apr, 18, 2025
2 min read
by NewsBTC

Privacy & Cookies Statement

Please read and accept our Privacy Policy & Cookies Statement to continue using our Site. This policy governs your provision of your personal data necessary to access our Site and/or particular services.

I have read, understood, and hereby accept the Privacy Policy & Cookies Statement and accept only essential cookies.