


Bitcoin Price Analysis: Breakout or Rejection Next as BTC Nears Upper Range Boundary?
Bitcoin remains within a high-volatility environment as market participants weigh macro uncertainty, ETF flows, and liquidity grabs. Following the recent rejection from the 110K level, the price continues to coil within a tight range, offering tactical opportunities for both sides of the tape.
By ShayanMarkets
The Daily Chart
On the daily timeframe, BTC is hovering between two well-defined liquidity zones. The 100K–110K range is acting as a battlefield between buyers and sellers, with visible reactions at both ends. The 100-day and 200-day moving averages continue trending upward and are now converging near the 95K mark, providing a strong dynamic support layer, especially if a bullish crossover occurs.
On the upside, the 110K level remains critical as it represents recent buy-side liquidity, and the price has failed to close above it multiple times. A daily close beyond that range would flip the market structure bullish again. Until then, the current choppy environment may persist, and even a short-term correction might be on the cards.
The 4-Hour Chart
Zooming into the 4H, we can see the asset reacting strongly to the bullish fair value gap at 103K, and bouncing into the bearish FVG around 106K. While this area acts as a clear resistance zone, the price is now breaking it to the upside, which could lead to a bullish leg toward the higher boundary of the large wedge pattern soon. The RSI is also climbing again, currently around 56, which indicates mild bullish momentum but not yet conviction.
As mentioned, to confirm the bullish continuation, the buyers must reclaim the 106K–107K zone with a clean break and sustained structure. On the contrary, failure to hold above this level could open up the door to revisit the larger 100K demand block below. Traders should remain cautious of potential deviations and liquidity hunts within this tight range.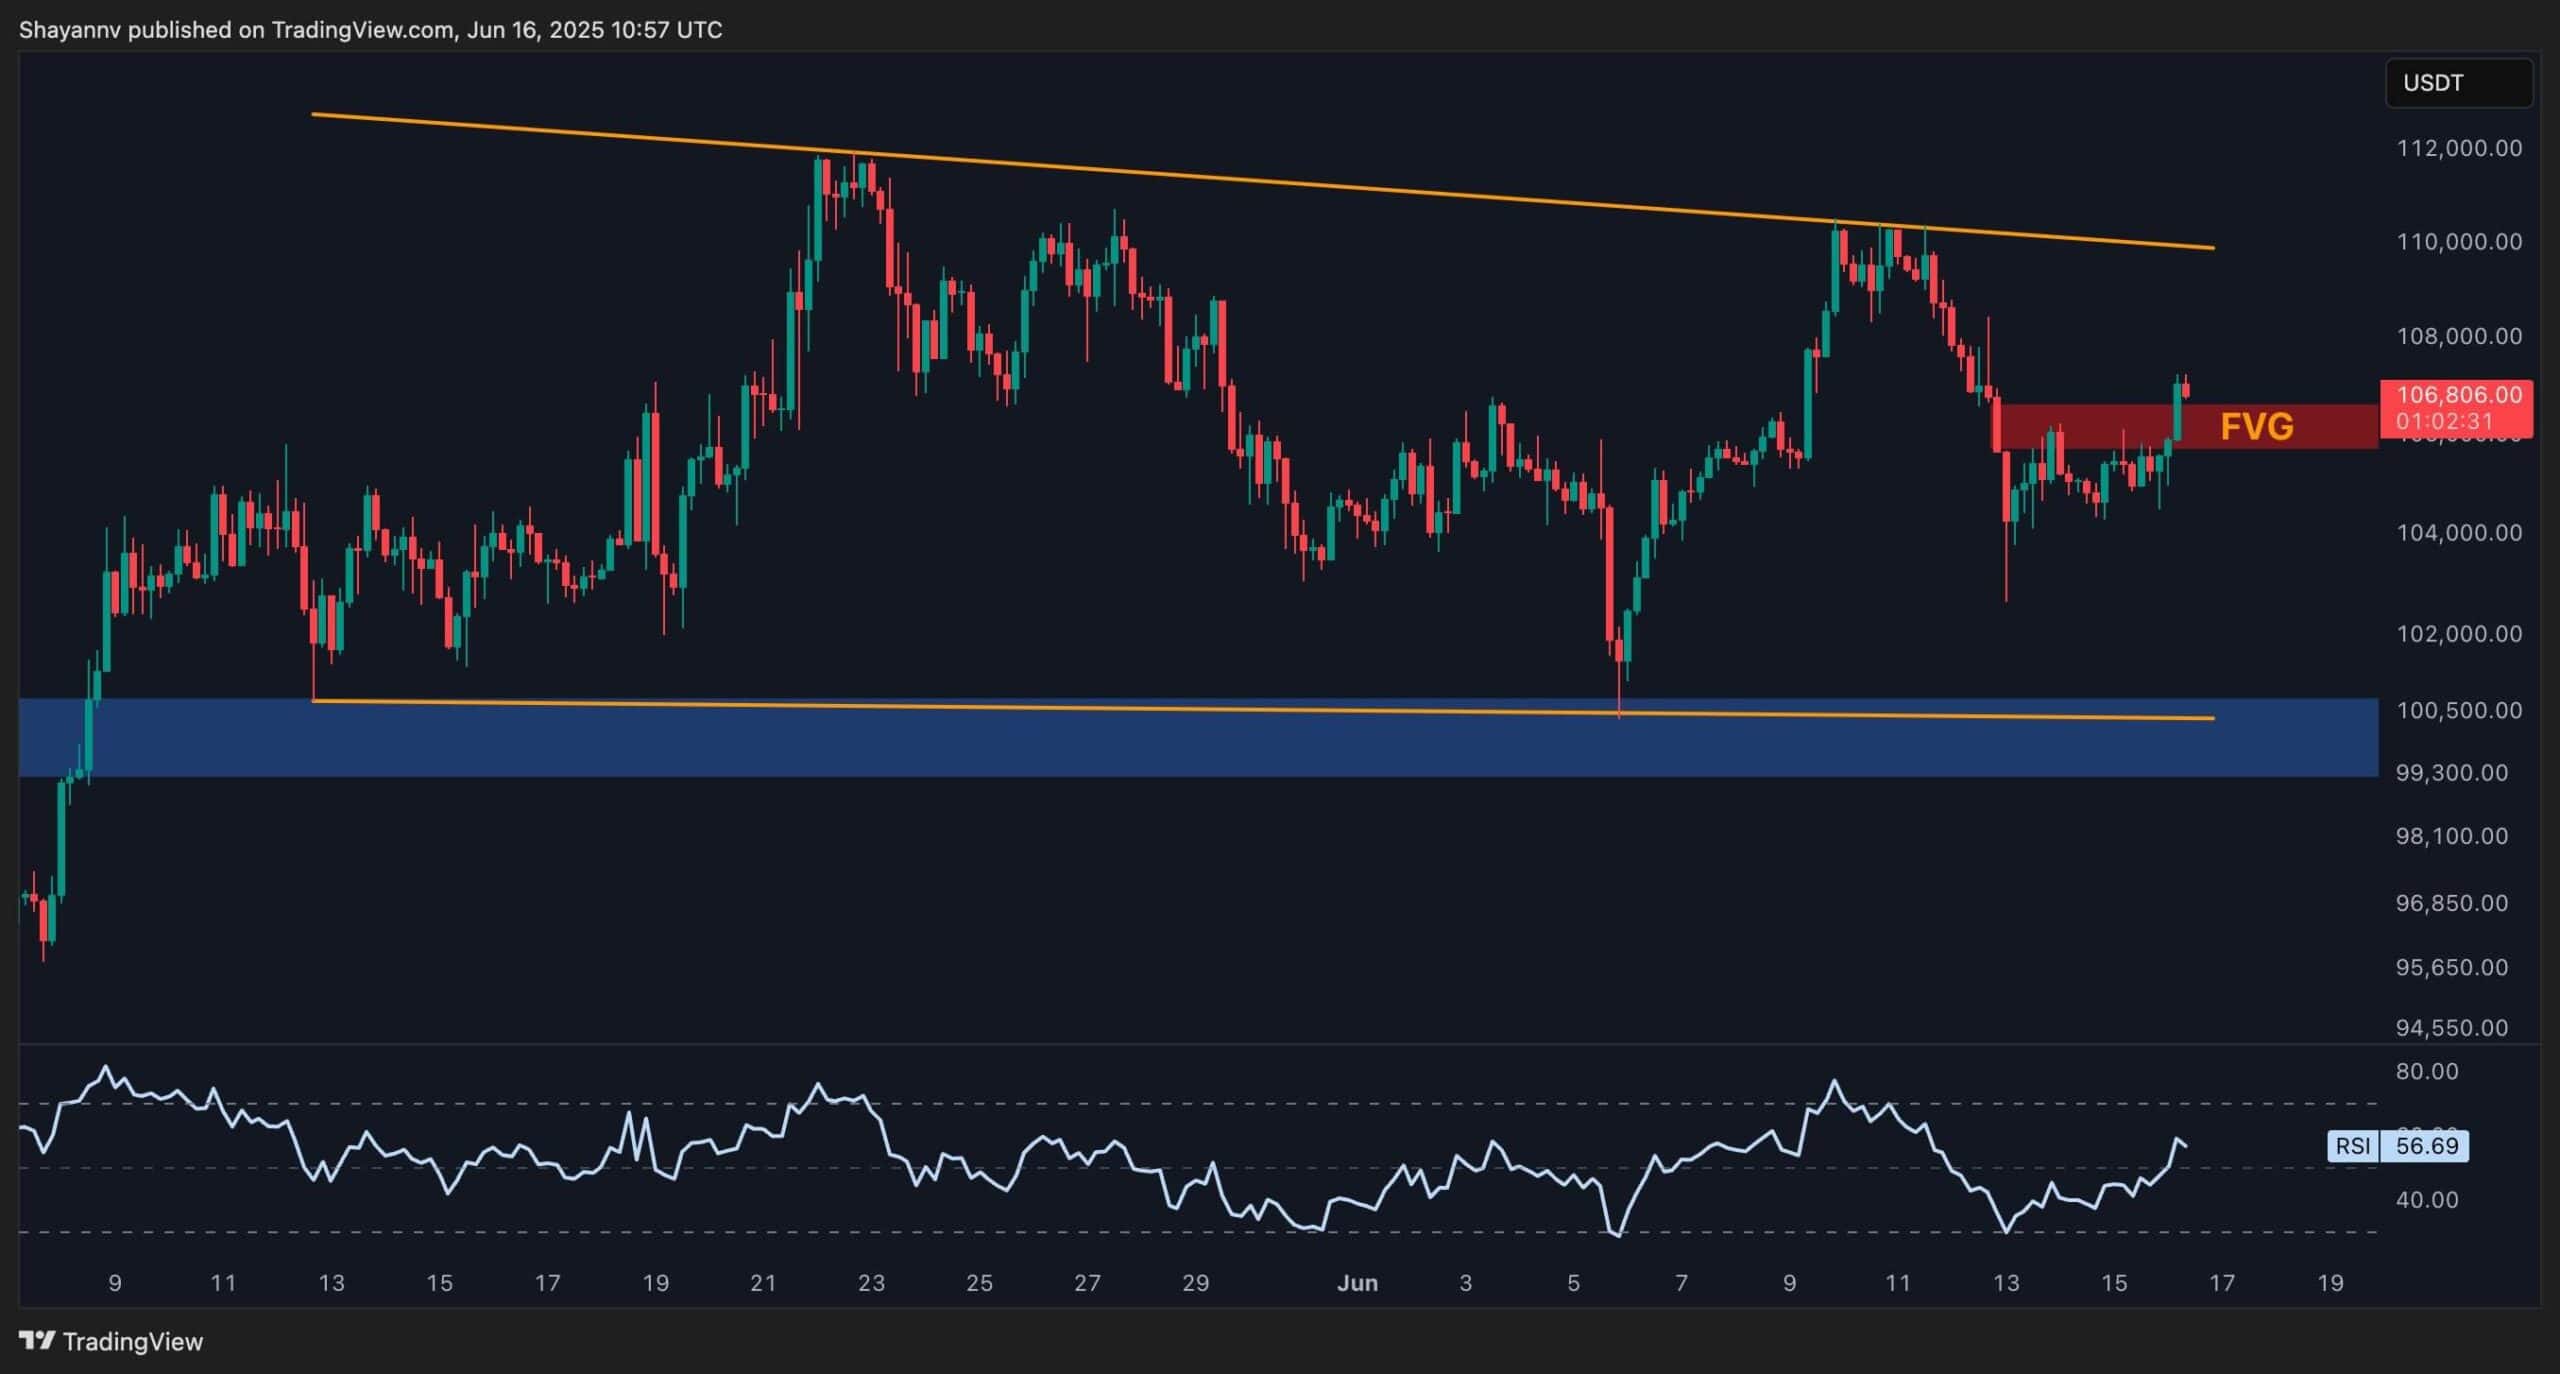
On-Chain Analysis
Exchange Reserve
Bitcoin’s exchange reserves have been in an aggressive downtrend since the beginning of 2025, now reaching their lowest point in years. This long-term drain in exchange-held BTC reflects a macro structural shift in investor behavior, as participants are increasingly choosing to self-custody their coins.
This behavior typically aligns with bullish conviction, as BTC moving off exchanges reduces immediate sell pressure and signals long-term holding intent.
However, there’s more to this than just sentiment. The structural supply shortage on exchanges creates a low-liquidity environment where even modest demand can cause exaggerated price moves. This dynamic helps explain BTC’s sharp rallies and equally sharp corrections.
As reserves continue to dwindle, the price may become even more sensitive to inflows or outflows, both from institutional buyers and retail. This environment favors volatility and sets the stage for explosive directional moves, especially as market structure tightens.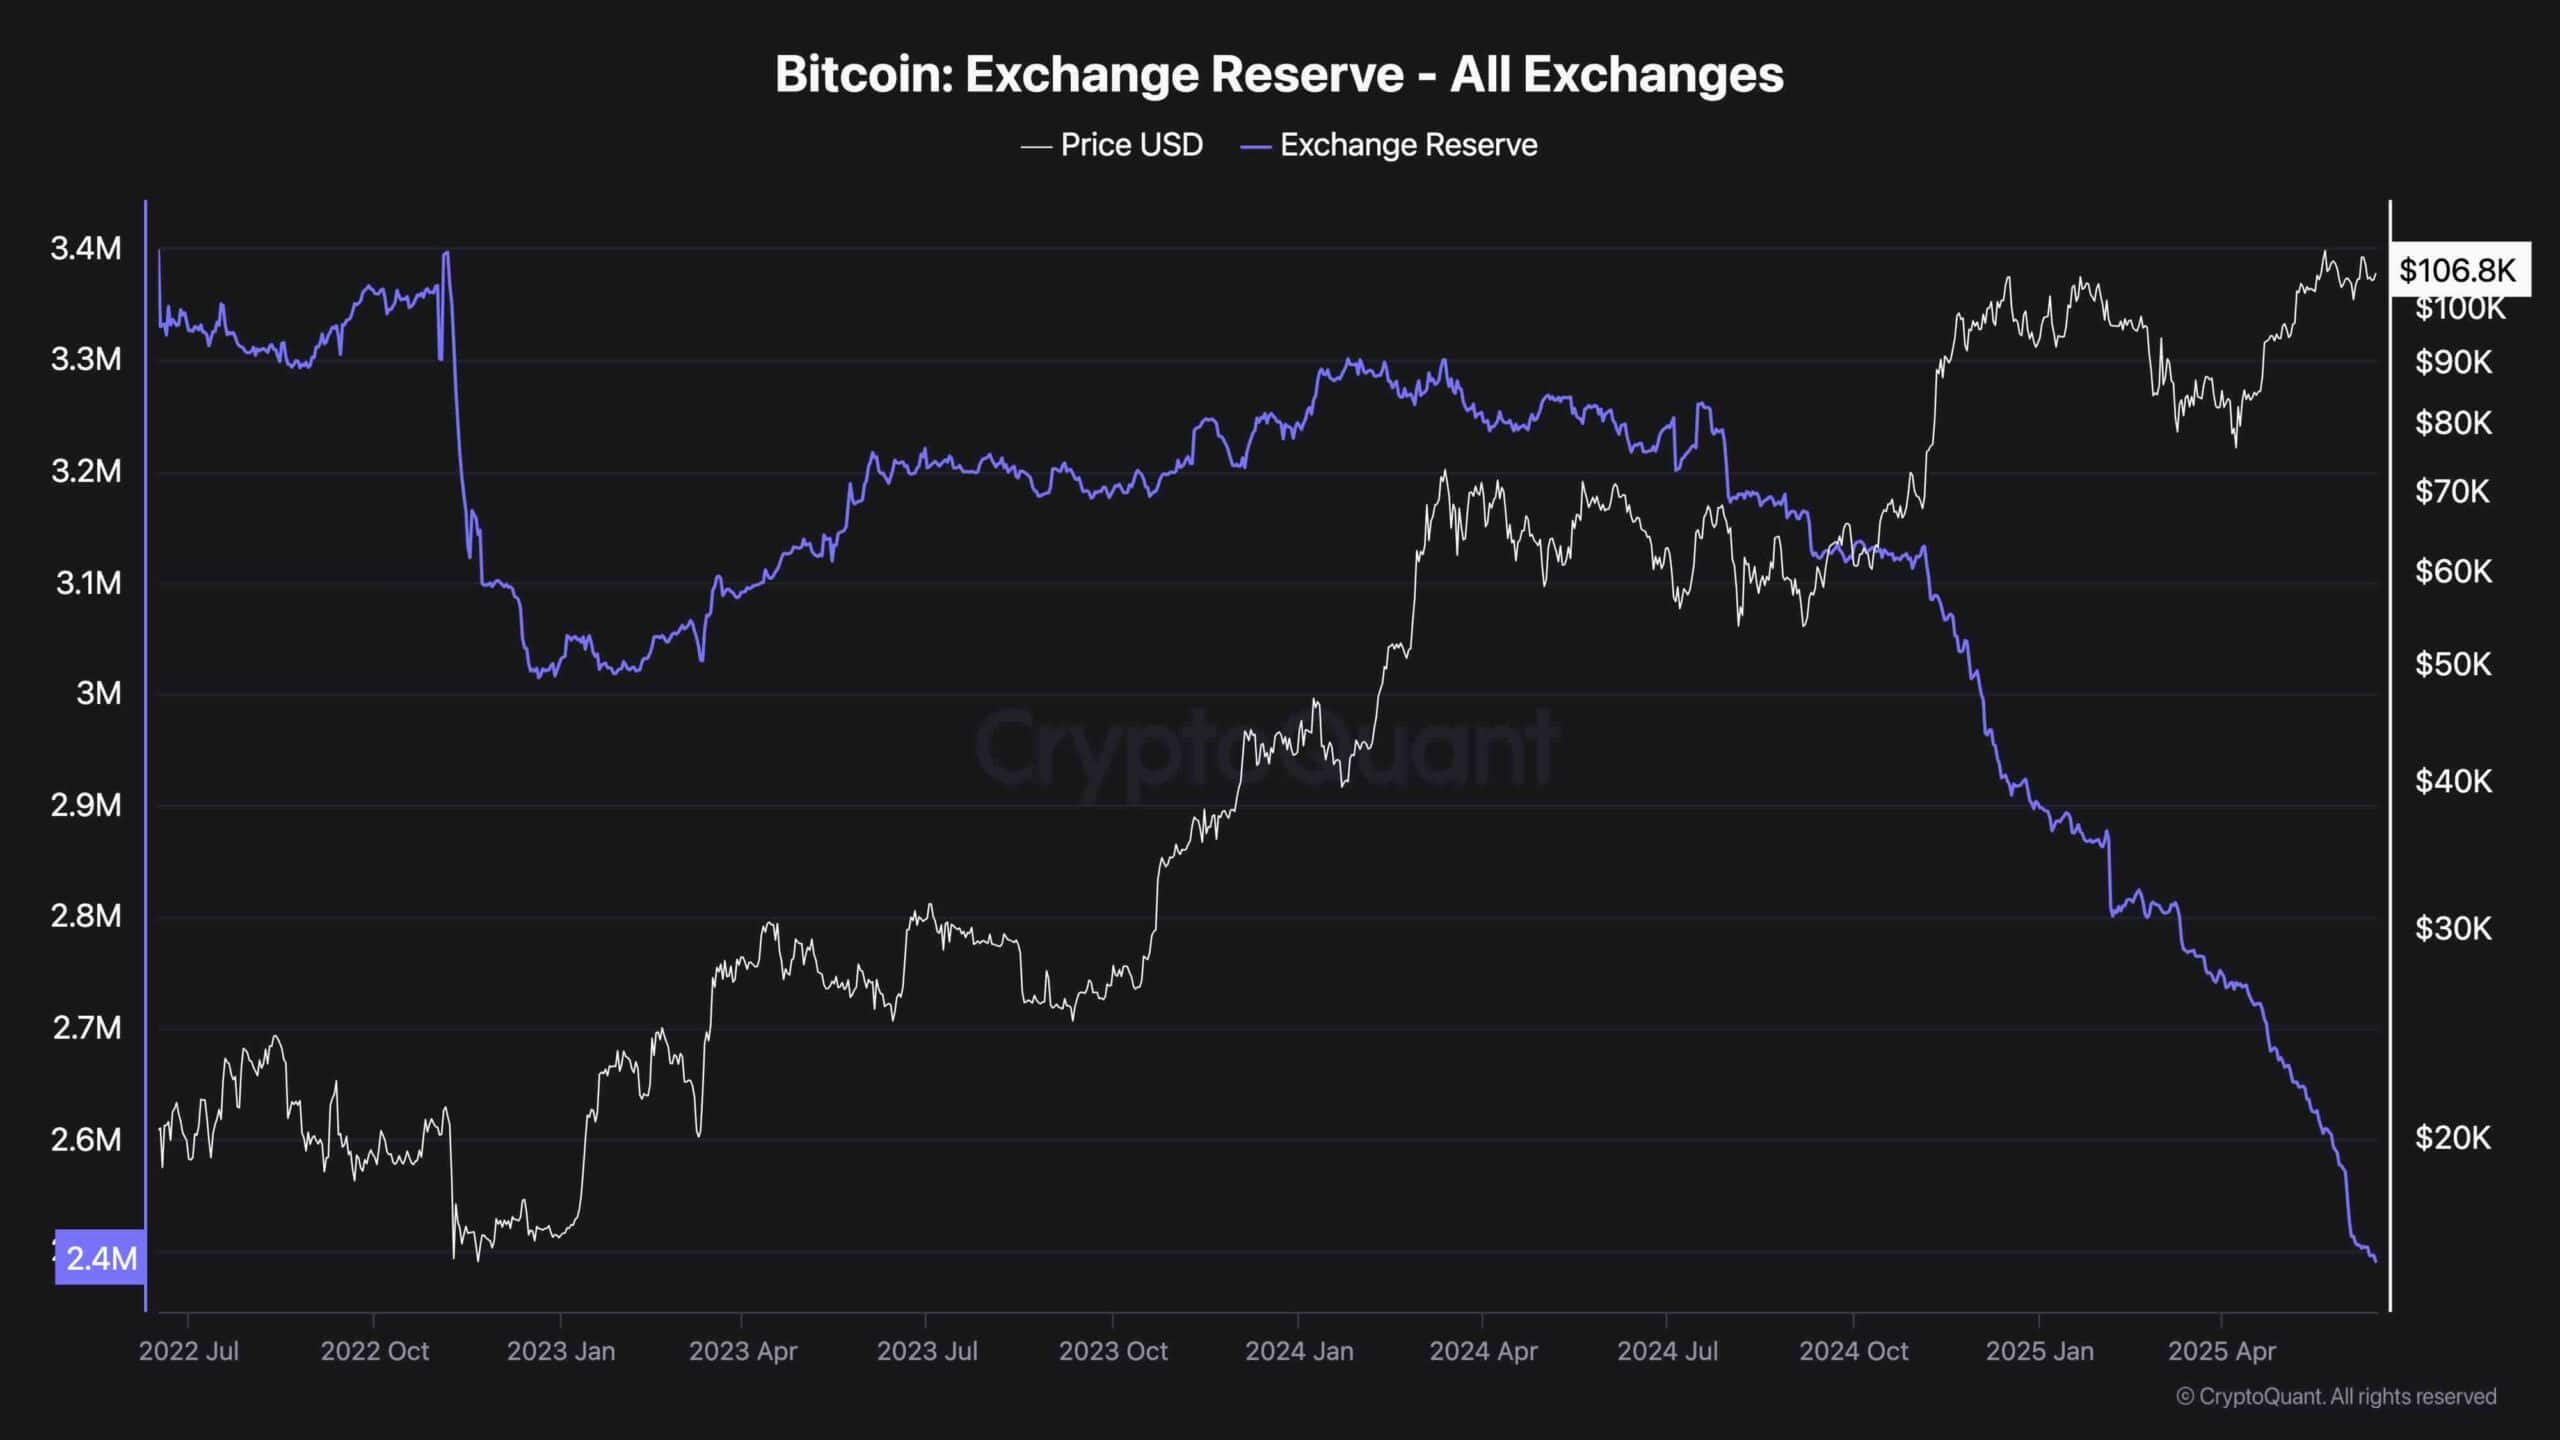
The post Bitcoin Price Analysis: Breakout or Rejection Next as BTC Nears Upper Range Boundary? appeared first on CryptoPotato.
Read More
Rare Investor Alignment Emerges as Bitcoin (BTC) Rallies From Geopolitical Dip

Trump Media and Technology Group Files to Launch Spot Bitcoin, Ethereum ETF
Bitcoin Price Analysis: Breakout or Rejection Next as BTC Nears Upper Range Boundary?
Bitcoin remains within a high-volatility environment as market participants weigh macro uncertainty, ETF flows, and liquidity grabs. Following the recent rejection from the 110K level, the price continues to coil within a tight range, offering tactical opportunities for both sides of the tape.
By ShayanMarkets
The Daily Chart
On the daily timeframe, BTC is hovering between two well-defined liquidity zones. The 100K–110K range is acting as a battlefield between buyers and sellers, with visible reactions at both ends. The 100-day and 200-day moving averages continue trending upward and are now converging near the 95K mark, providing a strong dynamic support layer, especially if a bullish crossover occurs.
On the upside, the 110K level remains critical as it represents recent buy-side liquidity, and the price has failed to close above it multiple times. A daily close beyond that range would flip the market structure bullish again. Until then, the current choppy environment may persist, and even a short-term correction might be on the cards.
The 4-Hour Chart
Zooming into the 4H, we can see the asset reacting strongly to the bullish fair value gap at 103K, and bouncing into the bearish FVG around 106K. While this area acts as a clear resistance zone, the price is now breaking it to the upside, which could lead to a bullish leg toward the higher boundary of the large wedge pattern soon. The RSI is also climbing again, currently around 56, which indicates mild bullish momentum but not yet conviction.
As mentioned, to confirm the bullish continuation, the buyers must reclaim the 106K–107K zone with a clean break and sustained structure. On the contrary, failure to hold above this level could open up the door to revisit the larger 100K demand block below. Traders should remain cautious of potential deviations and liquidity hunts within this tight range.
On-Chain Analysis
Exchange Reserve
Bitcoin’s exchange reserves have been in an aggressive downtrend since the beginning of 2025, now reaching their lowest point in years. This long-term drain in exchange-held BTC reflects a macro structural shift in investor behavior, as participants are increasingly choosing to self-custody their coins.
This behavior typically aligns with bullish conviction, as BTC moving off exchanges reduces immediate sell pressure and signals long-term holding intent.
However, there’s more to this than just sentiment. The structural supply shortage on exchanges creates a low-liquidity environment where even modest demand can cause exaggerated price moves. This dynamic helps explain BTC’s sharp rallies and equally sharp corrections.
As reserves continue to dwindle, the price may become even more sensitive to inflows or outflows, both from institutional buyers and retail. This environment favors volatility and sets the stage for explosive directional moves, especially as market structure tightens.
The post Bitcoin Price Analysis: Breakout or Rejection Next as BTC Nears Upper Range Boundary? appeared first on CryptoPotato.
Read More
Rare Investor Alignment Emerges as Bitcoin (BTC) Rallies From Geopolitical Dip