HBAR’s Heating Up Again—And This Chart’s Looking Familiar
- Analyst Steph Is Crypto says HBAR’s chart looks nearly identical to its late-2024 breakout setup, and a fresh network upgrade just went live.
- Resistance at $0.25 is the key level to watch—breaking it could open the door to a run toward $0.35 again.
- Hedera’s latest version (v0.63) launched smoothly, supporting bullish momentum as traders eye a 4-5 week window for potential upside.
Hedera’s back on the radar—and not just with the usual holders. Lately, there’s been a flurry of excitement thanks to a few chart whispers and a solid network upgrade that’s got traders perking up. According to analyst Steph Is Crypto, the current HBAR setup looks almost too similar to what we saw right before Hedera’s late-2024 breakout. That one led to a massive rally—so naturally, folks are watching this one real close.
Steph didn’t hold back. In a tweet that got passed around fast, he straight-up claimed that HBAR “could create many new millionaires in the next 4 to 5 weeks.” Bold, yeah, but it’s not all hype—there’s a pattern forming, and Hedera’s v0.63 upgrade just rolled out smoothly, which adds more fuel to the fire.
Déjà Vu on the Chart? Yeah, Kinda
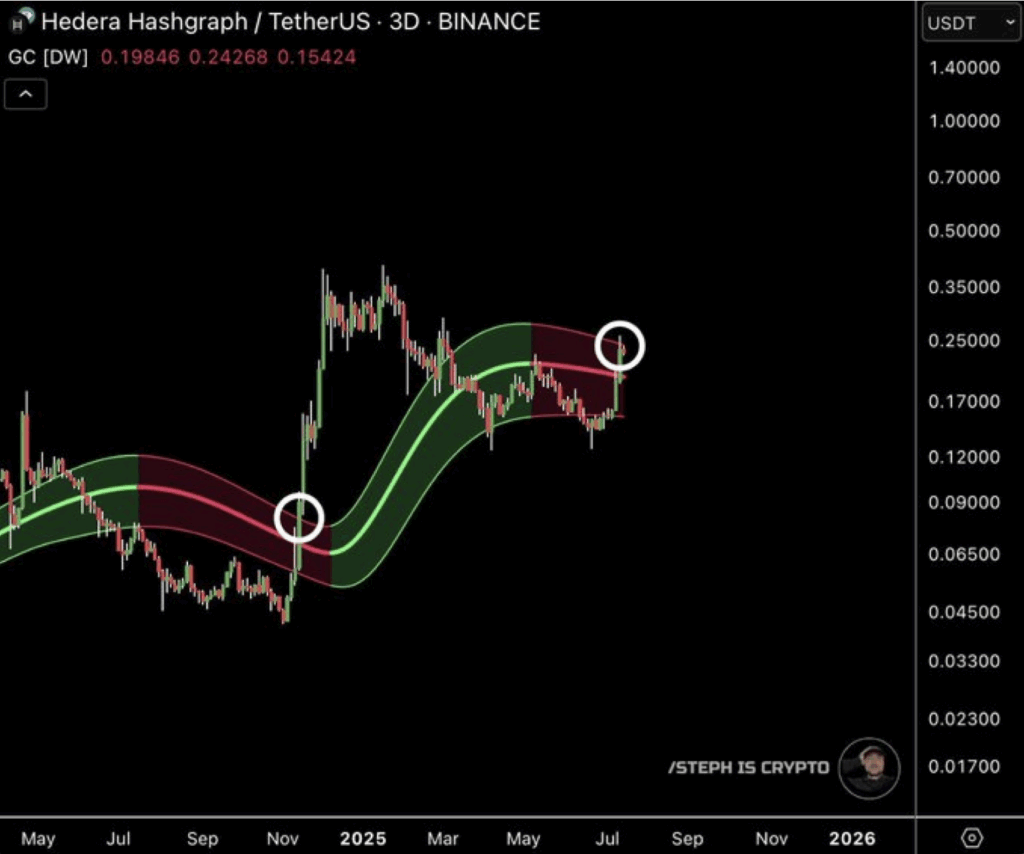
Steph dropped a 3-day HBAR chart from Binance, and if you squint (or don’t), the pattern’s hard to ignore. It uses what looks like a colored ribbon—probably a Gaussian channel—and shows a setup that played out back in 2024 and is showing up again now, mid-2025.
Last time this happened, HBAR pushed from below the red band up through green territory and sprinted all the way to around $0.35. Fast-forward to now, and the price is hanging out in the $0.19 to $0.24 range, just brushing up against that green band again. Traders see this as a repeat signal—maybe even a green light.
Resistance and Support: Key Zones to Watch
Right now, HBAR is flirting with resistance in the $0.24–$0.25 zone. That’s right at the edge of the ribbon’s upper limit—so if it breaks through clean, things could get spicy real fast. On the flip side, support sits around $0.14–$0.16, an area that’s held up well during pullbacks.
Traders who follow this kind of setup want to see price stay above resistance after breaking it—otherwise, it’s just noise. If HBAR does manage to bust past $0.25 and hold, then the next natural target’s the $0.30–$0.35 region. That’s where it topped out last time, and momentum could easily push it there again if the stars align.
One cool detail: that red-to-green color shift on the ribbon is often seen as a signal for renewed bullish pressure. And given the timing of the mainnet upgrade—with no bugs or hiccups—it’s possible the network is setting the stage for a more confident run.
— STEPH IS CRYPTO (@Steph_iscrypto) July 23, 2025
BREAKING:
HEDERA MAINNET UPGRADE TO V0.63 COMPLETED.
UPGRADE WAS SMOOTH — NO INTERRUPTIONS TO $HBAR TOKENOMICS OR STAKING FUNCTIONS. pic.twitter.com/PMXSH2W148
So What Now?
If this is a repeat of the 2024 move, then HBAR might have 4 to 5 weeks to make some serious noise. That’s the exact timeframe Steph dropped in his tweet, and it’s how long it took for the last breakout to go from zero to “holy crap” levels.
Volume and wider market conditions will obviously play a role, but the chart’s structure, the shift in trend, and the fact that the upgrade went off without a hitch—all that points to HBAR entering a pretty critical window.
Now all eyes are locked on the $0.25 zone. If it breaks and holds, well… don’t be surprised if HBAR starts popping up all over your feed again.
The post HBAR’s Heating Up Again—And This Chart’s Looking Familiar first appeared on BlockNews.
Read More


Hyperliquid Gains as Arthur Hayes Predicts 126x Surge
HBAR’s Heating Up Again—And This Chart’s Looking Familiar
- Analyst Steph Is Crypto says HBAR’s chart looks nearly identical to its late-2024 breakout setup, and a fresh network upgrade just went live.
- Resistance at $0.25 is the key level to watch—breaking it could open the door to a run toward $0.35 again.
- Hedera’s latest version (v0.63) launched smoothly, supporting bullish momentum as traders eye a 4-5 week window for potential upside.
Hedera’s back on the radar—and not just with the usual holders. Lately, there’s been a flurry of excitement thanks to a few chart whispers and a solid network upgrade that’s got traders perking up. According to analyst Steph Is Crypto, the current HBAR setup looks almost too similar to what we saw right before Hedera’s late-2024 breakout. That one led to a massive rally—so naturally, folks are watching this one real close.
Steph didn’t hold back. In a tweet that got passed around fast, he straight-up claimed that HBAR “could create many new millionaires in the next 4 to 5 weeks.” Bold, yeah, but it’s not all hype—there’s a pattern forming, and Hedera’s v0.63 upgrade just rolled out smoothly, which adds more fuel to the fire.
Déjà Vu on the Chart? Yeah, Kinda
Steph dropped a 3-day HBAR chart from Binance, and if you squint (or don’t), the pattern’s hard to ignore. It uses what looks like a colored ribbon—probably a Gaussian channel—and shows a setup that played out back in 2024 and is showing up again now, mid-2025.
Last time this happened, HBAR pushed from below the red band up through green territory and sprinted all the way to around $0.35. Fast-forward to now, and the price is hanging out in the $0.19 to $0.24 range, just brushing up against that green band again. Traders see this as a repeat signal—maybe even a green light.
Resistance and Support: Key Zones to Watch
Right now, HBAR is flirting with resistance in the $0.24–$0.25 zone. That’s right at the edge of the ribbon’s upper limit—so if it breaks through clean, things could get spicy real fast. On the flip side, support sits around $0.14–$0.16, an area that’s held up well during pullbacks.
Traders who follow this kind of setup want to see price stay above resistance after breaking it—otherwise, it’s just noise. If HBAR does manage to bust past $0.25 and hold, then the next natural target’s the $0.30–$0.35 region. That’s where it topped out last time, and momentum could easily push it there again if the stars align.
One cool detail: that red-to-green color shift on the ribbon is often seen as a signal for renewed bullish pressure. And given the timing of the mainnet upgrade—with no bugs or hiccups—it’s possible the network is setting the stage for a more confident run.
— STEPH IS CRYPTO (@Steph_iscrypto) July 23, 2025
HEDERA MAINNET UPGRADE TO V0.63 COMPLETED.
UPGRADE WAS SMOOTH — NO INTERRUPTIONS TO $HBAR TOKENOMICS OR STAKING FUNCTIONS. pic.twitter.com/PMXSH2W148
So What Now?
If this is a repeat of the 2024 move, then HBAR might have 4 to 5 weeks to make some serious noise. That’s the exact timeframe Steph dropped in his tweet, and it’s how long it took for the last breakout to go from zero to “holy crap” levels.
Volume and wider market conditions will obviously play a role, but the chart’s structure, the shift in trend, and the fact that the upgrade went off without a hitch—all that points to HBAR entering a pretty critical window.
Now all eyes are locked on the $0.25 zone. If it breaks and holds, well… don’t be surprised if HBAR starts popping up all over your feed again.
The post HBAR’s Heating Up Again—And This Chart’s Looking Familiar first appeared on BlockNews.
Read More