Can a Sudden 141% Volume Surge Push BEAM Out of Its Slump?

Share:
Predictions Markets
See what traders are focused on

- BEAM recorded a loss of over 3%, trading at $0.0059.
- Its daily trading volume exploded by 141%.
Yesterday’s bullish spike could not sustain its momentum, and the broader crypto market cap has pulled back to $3.37 trillion. Major assets have returned to recent lows, painting the charts red. Among them, BEAM joined the suit, displaying a bearish price movement with a 3.60% drop in the past 24 hours.
In the early hours, BEAM has recorded its highest price at $0.006614. With the sudden bear encounter, the asset’s price has retraced to q low range of $0.005953. At the time of writing, BEAM trades at $0.005925, with its market cap at $292 million, as per CMC data. Concurrently, the daily trading volume has exploded by over 141%, reaching $58.52 million.
While zooming in on the last seven-day price chart of BEAM, it has recorded a surge of over 12.41%. The asset began the week trading at $0.0052, and later it rose to a high of $0.0064 and to the current trading zone.
What Lies Ahead for BEAM?
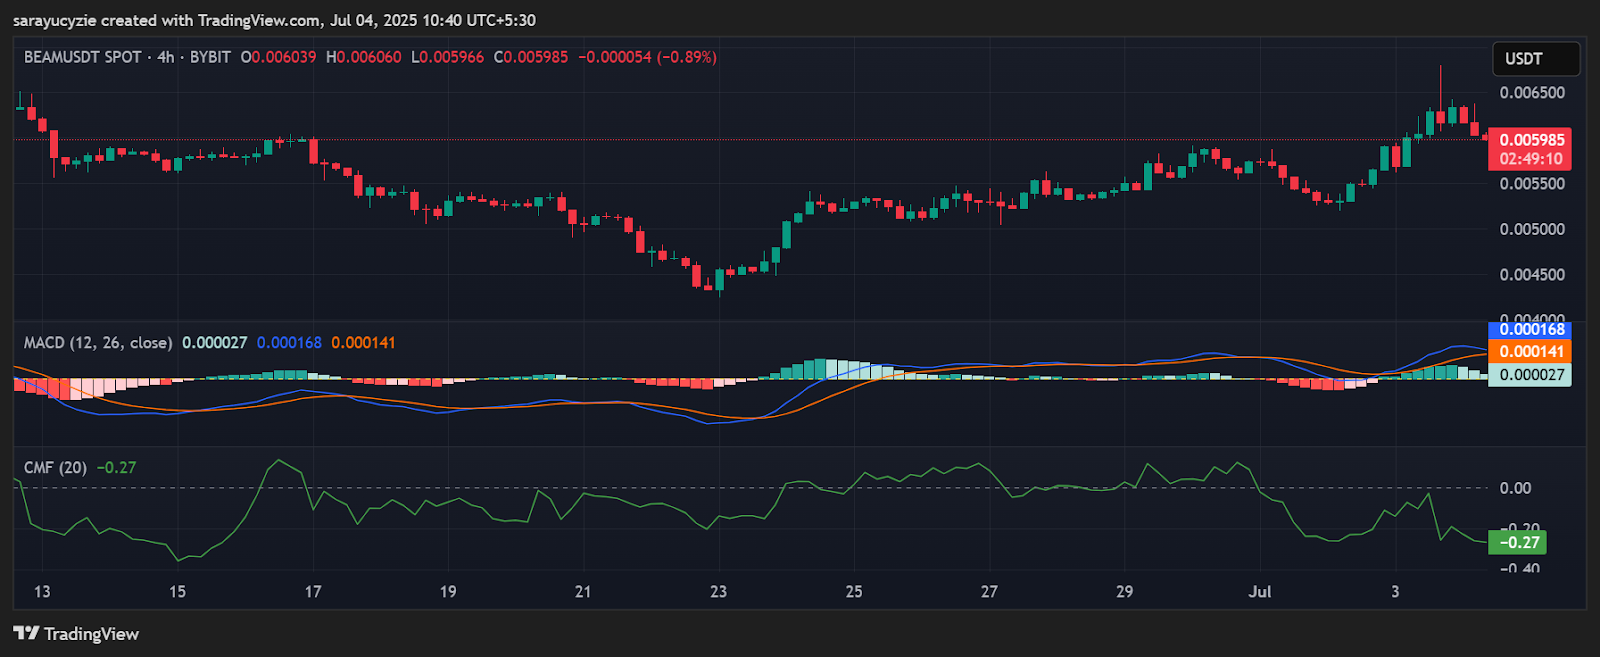
The four-hour technical chart analysis of BEAM exhibits that the Moving Average Convergence Divergence (MACD) line is briefly above the signal line, indicating a positive sentiment. The momentum should gain strength to confirm the uptrend. Besides, the Chaikin Money Flow (CMF) indicator is found at -0.27, suggesting that the money is flowing out of the asset. Also, moderate selling pressure is present in the market, with potential price weakness.
Notably, the recent trading session reported a brief period of bullish momentum. The price might move up and find its nearby resistance at $0.006059. If the upside correction strengthens, BEAM could steadily climb toward the subsequent resistance mark at $0.006065. Upon breaking this range, the bulls may likely trigger more gains ahead.
On the downside, if the asset’s uptrend fades, it might fall toward the immediate support at the range of $0.006049. Assuming BEAM fails to hold this price level, the potent bears could lead to a steeper drop and reach its key support below the $0.006048 zone. Further downside correction may push the price to its former lows.
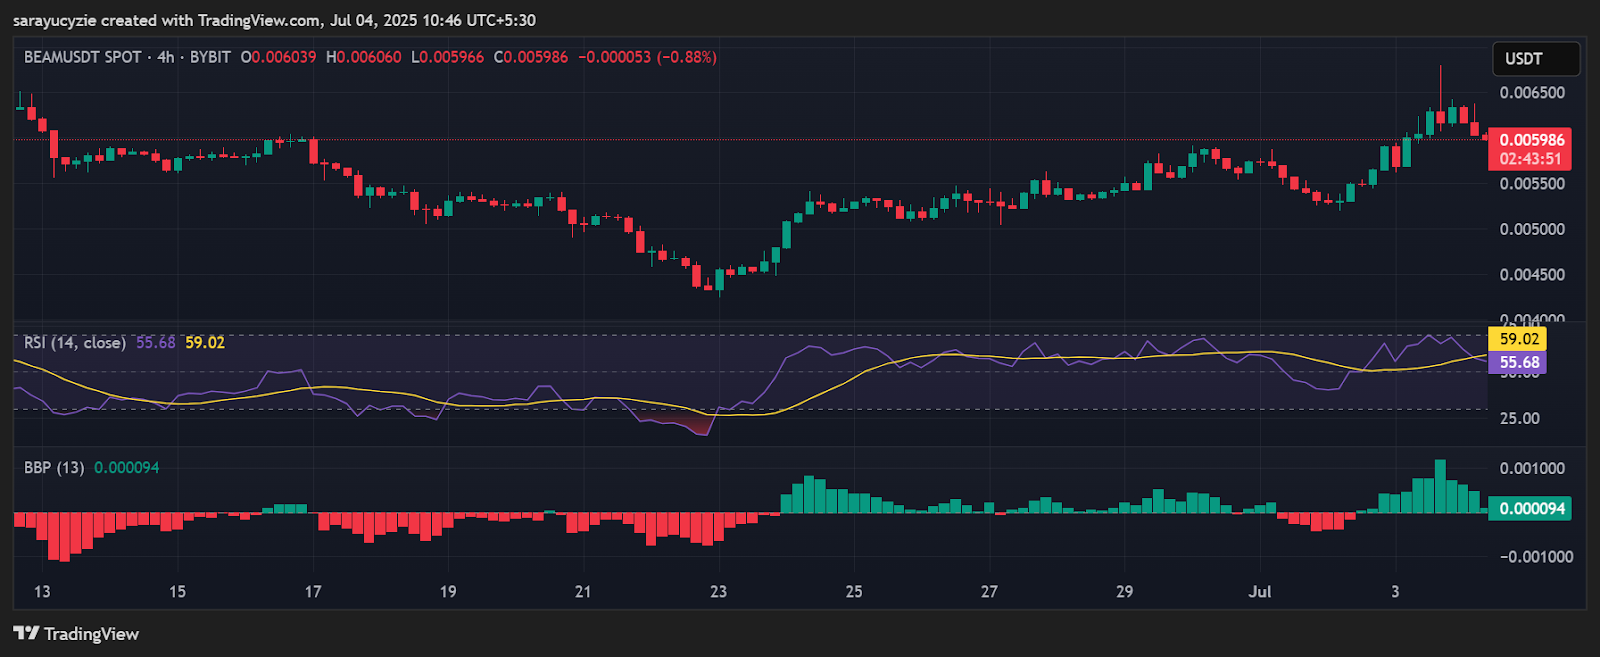
BEAM’s current market sentiment is neutral to mildly bullish as the daily Relative Strength Index (RSI) is staying at 55.68. It hints that there is room for upward movement if buying pressure increases. Furthermore, the Bull Bear Power (BBP) value of 0.000094 signals a near balance between bullish and bearish forces.
Highlighted Crypto News


Read More

Tether News: Q2 Profit Hits $1.5B as USDT Supply Reaches $184.6B