XRP Hits Multi-Year High Before Facing Resistance

- XRP hit $3.66 but failed to hold, prompting a correction toward the $3.00–$2.80 range.
- Key support lies at the 20-day EMA ($2.99); a strong bounce may lead to a retest of $3.66.
- Failure to recover above short-term moving averages could lead to a deeper drop toward $2.60.
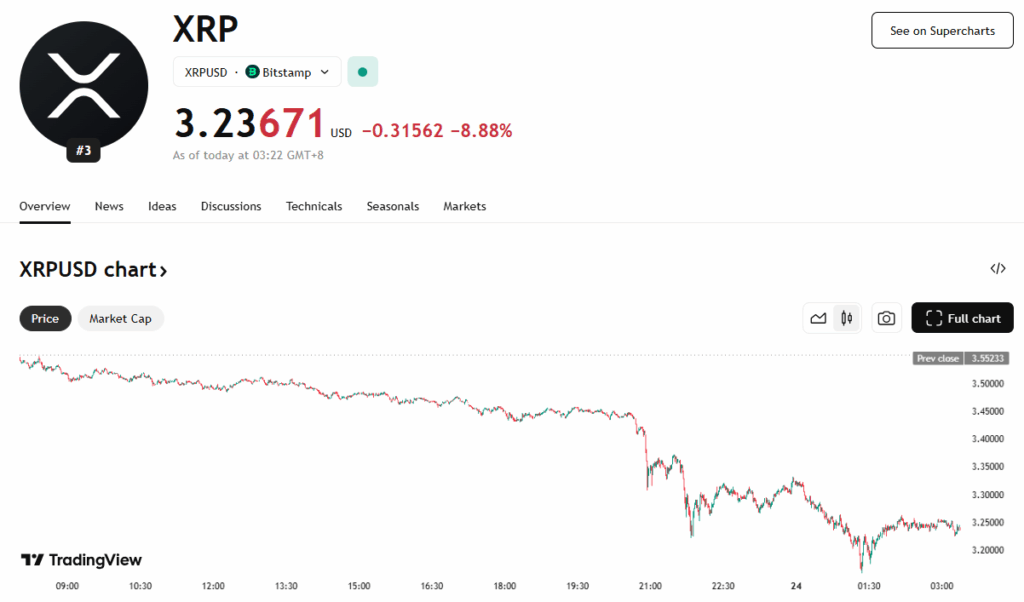
XRP surged to a multi-year high of $3.66 on Friday, showcasing strong bullish momentum. This rally was so significant that XRP’s market cap briefly overtook that of McDonald’s. However, the move stalled, prompting short-term investors to take profits, which caused a dip in price. The inability to sustain above $3.66 has raised questions about the next critical levels to monitor.
Price Prediction: Key Support and Resistance Levels
After failing to hold above $3.66, XRP slipped below $3.40, suggesting a possible near-term pullback. The next crucial support lies at the 20-day EMA, currently around $2.99. If bulls defend this level and the price rebounds strongly, it would indicate solid demand at lower prices. A successful bounce could reestablish a push toward $3.66, and breaking above that may open the door to $4 or even $4.86.
On the flip side, a drop below the 20-day EMA would weaken the bullish outlook. Such a move would suggest that the breakout above $3.40 might have been a false signal, potentially inviting more bearish pressure.
4-Hour Chart Reveals Bearish Attempts
Shorter timeframe charts, such as the 4-hour, show XRP breaking down from the $3.34 support. This indicates bears are attempting to regain control. The next key supports to watch are $3.00 and $2.80. A recovery from this support zone that breaches the moving averages could signal the end of the corrective phase and a potential move back toward $3.66.
However, if the price fails to surpass the 20-EMA, it would imply a shift in market sentiment—from dip buying to rally selling. This would raise the chances of a deeper correction, possibly toward $2.60, which could stall the broader uptrend.
The post XRP Hits Multi-Year High Before Facing Resistance first appeared on BlockNews.
Read More

XRP Hits Multi-Year High Before Facing Resistance
- XRP hit $3.66 but failed to hold, prompting a correction toward the $3.00–$2.80 range.
- Key support lies at the 20-day EMA ($2.99); a strong bounce may lead to a retest of $3.66.
- Failure to recover above short-term moving averages could lead to a deeper drop toward $2.60.
XRP surged to a multi-year high of $3.66 on Friday, showcasing strong bullish momentum. This rally was so significant that XRP’s market cap briefly overtook that of McDonald’s. However, the move stalled, prompting short-term investors to take profits, which caused a dip in price. The inability to sustain above $3.66 has raised questions about the next critical levels to monitor.
Price Prediction: Key Support and Resistance Levels
After failing to hold above $3.66, XRP slipped below $3.40, suggesting a possible near-term pullback. The next crucial support lies at the 20-day EMA, currently around $2.99. If bulls defend this level and the price rebounds strongly, it would indicate solid demand at lower prices. A successful bounce could reestablish a push toward $3.66, and breaking above that may open the door to $4 or even $4.86.
On the flip side, a drop below the 20-day EMA would weaken the bullish outlook. Such a move would suggest that the breakout above $3.40 might have been a false signal, potentially inviting more bearish pressure.
4-Hour Chart Reveals Bearish Attempts
Shorter timeframe charts, such as the 4-hour, show XRP breaking down from the $3.34 support. This indicates bears are attempting to regain control. The next key supports to watch are $3.00 and $2.80. A recovery from this support zone that breaches the moving averages could signal the end of the corrective phase and a potential move back toward $3.66.
However, if the price fails to surpass the 20-EMA, it would imply a shift in market sentiment—from dip buying to rally selling. This would raise the chances of a deeper correction, possibly toward $2.60, which could stall the broader uptrend.
The post XRP Hits Multi-Year High Before Facing Resistance first appeared on BlockNews.
Read More