Bitcoin Could Now ‘Go Vertical’ As Several Critical Indicators Align, According to Crypto Analyst

A popular crypto analyst says Bitcoin (BTC) may be gearing up for a massive breakout based on several aligning indicators.
Pseudonymous analyst TechDev tells his 443,100 followers on the social media platform X that the Wyckoff accumulation schematic is bullish for digital assets.
He also says that the Gaussian channel is indicating digital assets are about to take off on a massive uptrend. Gaussian channels are momentum indicators that can be used to identify price tops and bottoms.
“This is usually the place where things go vertical.”
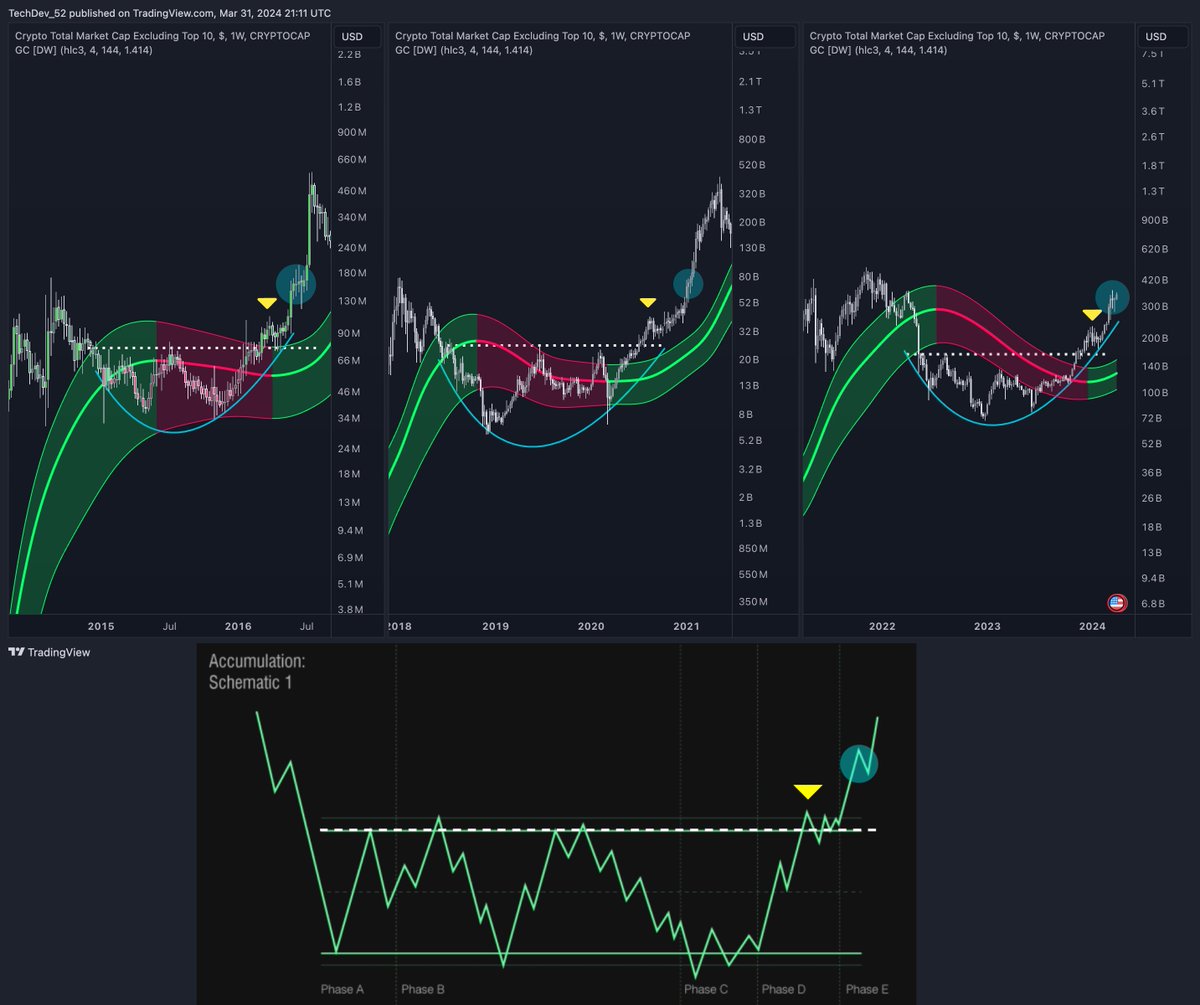
Looking at the charts, the analyst suggests that the Wyckoff accumulation schematic is entering Phase E of the pattern, which indicates the markup phase or a period of price rises.
The analyst’s Gaussian channel is applied to the market cap of digital assets excluding the top 10 and suggests that the current crypto market is repeating a similar pattern in 2016 and 2020 that preceded a massive uptrend.
The analyst also says that Bitcoin is positioned on the weekly chart in relation to key indicators as it was in 2020 before it went on to print new all-time highs (ATHs).
“Once again at the intersection of the prior ATH and 2x 350-day moving average (DMA), with two-month MACD (moving average convergence divergence) in the green.”
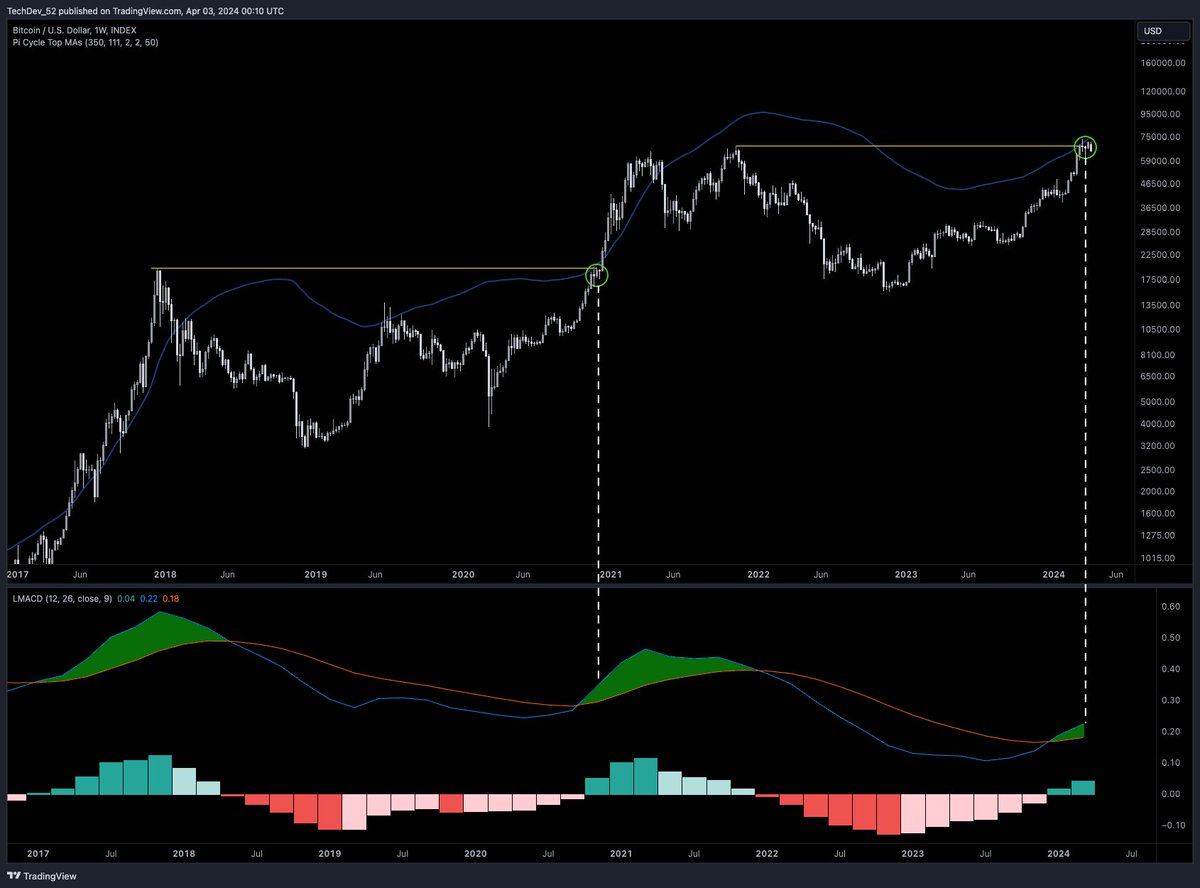
The MACD is traditionally used to spot trend reversals and confirm trends.
Lastly, the analyst shares Bitcoin’s two-month chart with the Bollinger bands bandwidth (BBW) indicating the crypto king is on the verge of soaring.
The BBW is a price volatility gauge that sees its upper and lower bands widen when volatility declines while the bands contract when volatility is about to explode.
“Two-month expansion has only just begun.
As RSI (Relative Strength Index) has only just crossed the channel EQ (equilibrium).”
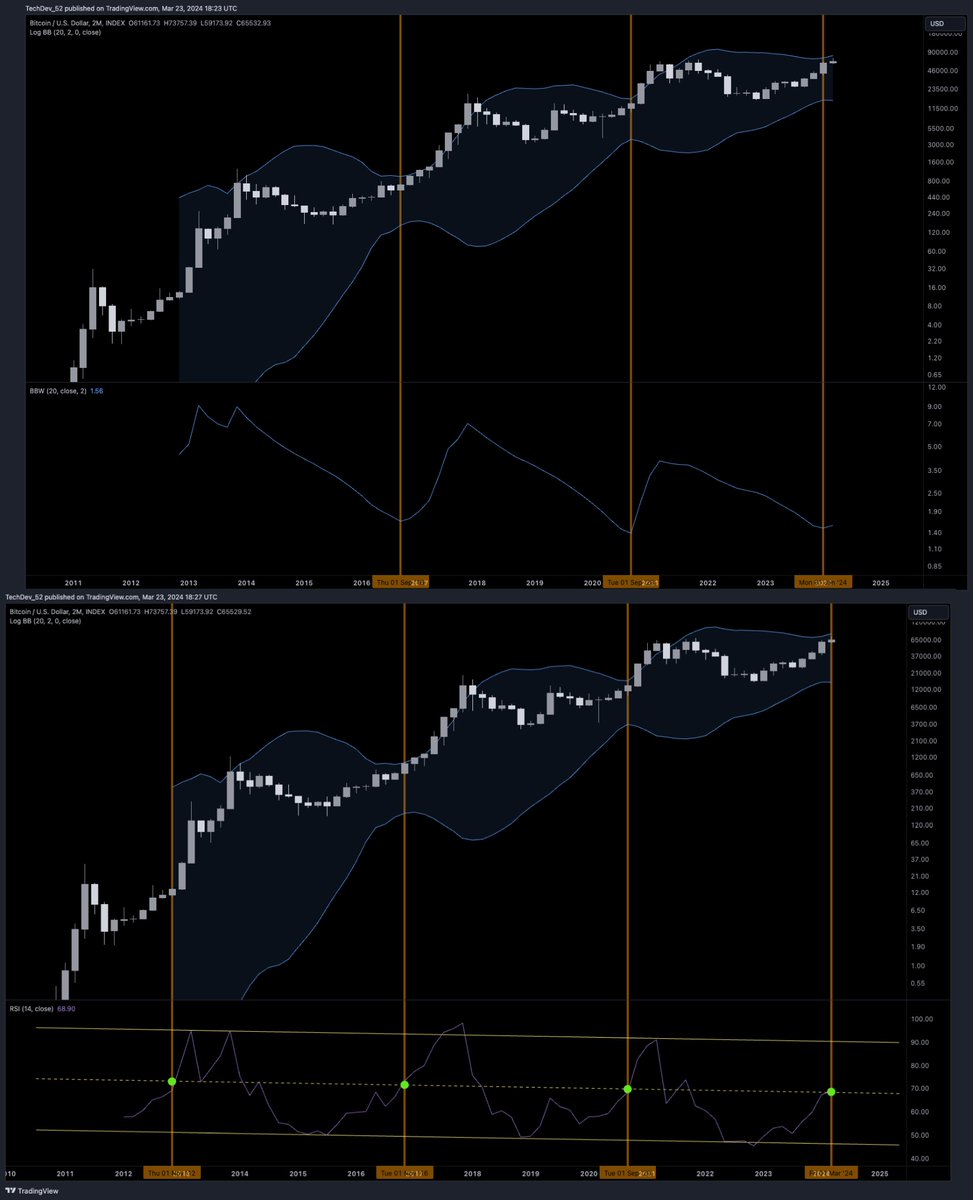
The analyst’s chart also shows the RSI, a widely used momentum indicator that aims to determine if an asset is overbought or oversold.
Bitcoin is trading for 66,117 at time of writing, up slightly in the last 24 hours.
Don't Miss a Beat – Subscribe to get email alerts delivered directly to your inbox
Check Price Action
Follow us on Twitter, Facebook and Telegram
Surf The Daily Hodl Mix

Disclaimer: Opinions expressed at The Daily Hodl are not investment advice. Investors should do their due diligence before making any high-risk investments in Bitcoin, cryptocurrency or digital assets. Please be advised that your transfers and trades are at your own risk, and any loses you may incur are your responsibility. The Daily Hodl does not recommend the buying or selling of any cryptocurrencies or digital assets, nor is The Daily Hodl an investment advisor. Please note that The Daily Hodl participates in affiliate marketing.
Generated Image: DALLE3
The post Bitcoin Could Now ‘Go Vertical’ As Several Critical Indicators Align, According to Crypto Analyst appeared first on The Daily Hodl.
Read More


Bitcoin Whale Activates Dormant Wallet with 80,009 BTC
Bitcoin Could Now ‘Go Vertical’ As Several Critical Indicators Align, According to Crypto Analyst
A popular crypto analyst says Bitcoin (BTC) may be gearing up for a massive breakout based on several aligning indicators.
Pseudonymous analyst TechDev tells his 443,100 followers on the social media platform X that the Wyckoff accumulation schematic is bullish for digital assets.
He also says that the Gaussian channel is indicating digital assets are about to take off on a massive uptrend. Gaussian channels are momentum indicators that can be used to identify price tops and bottoms.
“This is usually the place where things go vertical.”
Looking at the charts, the analyst suggests that the Wyckoff accumulation schematic is entering Phase E of the pattern, which indicates the markup phase or a period of price rises.
The analyst’s Gaussian channel is applied to the market cap of digital assets excluding the top 10 and suggests that the current crypto market is repeating a similar pattern in 2016 and 2020 that preceded a massive uptrend.
The analyst also says that Bitcoin is positioned on the weekly chart in relation to key indicators as it was in 2020 before it went on to print new all-time highs (ATHs).
“Once again at the intersection of the prior ATH and 2x 350-day moving average (DMA), with two-month MACD (moving average convergence divergence) in the green.”
The MACD is traditionally used to spot trend reversals and confirm trends.
Lastly, the analyst shares Bitcoin’s two-month chart with the Bollinger bands bandwidth (BBW) indicating the crypto king is on the verge of soaring.
The BBW is a price volatility gauge that sees its upper and lower bands widen when volatility declines while the bands contract when volatility is about to explode.
“Two-month expansion has only just begun.
As RSI (Relative Strength Index) has only just crossed the channel EQ (equilibrium).”
The analyst’s chart also shows the RSI, a widely used momentum indicator that aims to determine if an asset is overbought or oversold.
Bitcoin is trading for 66,117 at time of writing, up slightly in the last 24 hours.
Don't Miss a Beat – Subscribe to get email alerts delivered directly to your inbox
Check Price Action
Follow us on Twitter, Facebook and Telegram
Surf The Daily Hodl Mix
Disclaimer: Opinions expressed at The Daily Hodl are not investment advice. Investors should do their due diligence before making any high-risk investments in Bitcoin, cryptocurrency or digital assets. Please be advised that your transfers and trades are at your own risk, and any loses you may incur are your responsibility. The Daily Hodl does not recommend the buying or selling of any cryptocurrencies or digital assets, nor is The Daily Hodl an investment advisor. Please note that The Daily Hodl participates in affiliate marketing.
Generated Image: DALLE3
The post Bitcoin Could Now ‘Go Vertical’ As Several Critical Indicators Align, According to Crypto Analyst appeared first on The Daily Hodl.
Read More