


Ripple Price Analysis: XRP’s Outlook Following Rebound at $1.70
Ripple’s native token has staged a notable rebound from the crucial $1.7 support level, signaling renewed buying interest.
However, the price is now approaching a key resistance zone, where a breakout could trigger a bullish retracement toward the 100-day moving average at $2.5.
XRP Analysis
By Shayan
The Daily Chart
XRP managed to rebound from the crucial $1.7 support region, which aligns with the 200-day moving average and the 0.5–0.618 Fibonacci retracement range.
This confluence of support levels has triggered increased buying activity, temporarily halting the downtrend. Additionally, a bullish divergence between the price and the RSI suggests waning bearish momentum, increasing the likelihood of a potential trend reversal.
Despite the rebound, XRP remains trapped between the 100-day and 200-day moving averages, pointing toward a consolidation phase. Notably, the 100-day MA at $2.5 coincides with the upper boundary of a prolonged descending wedge pattern. A breakout above this level could confirm a bullish shift and initiate a fresh upward leg toward higher resistance zones.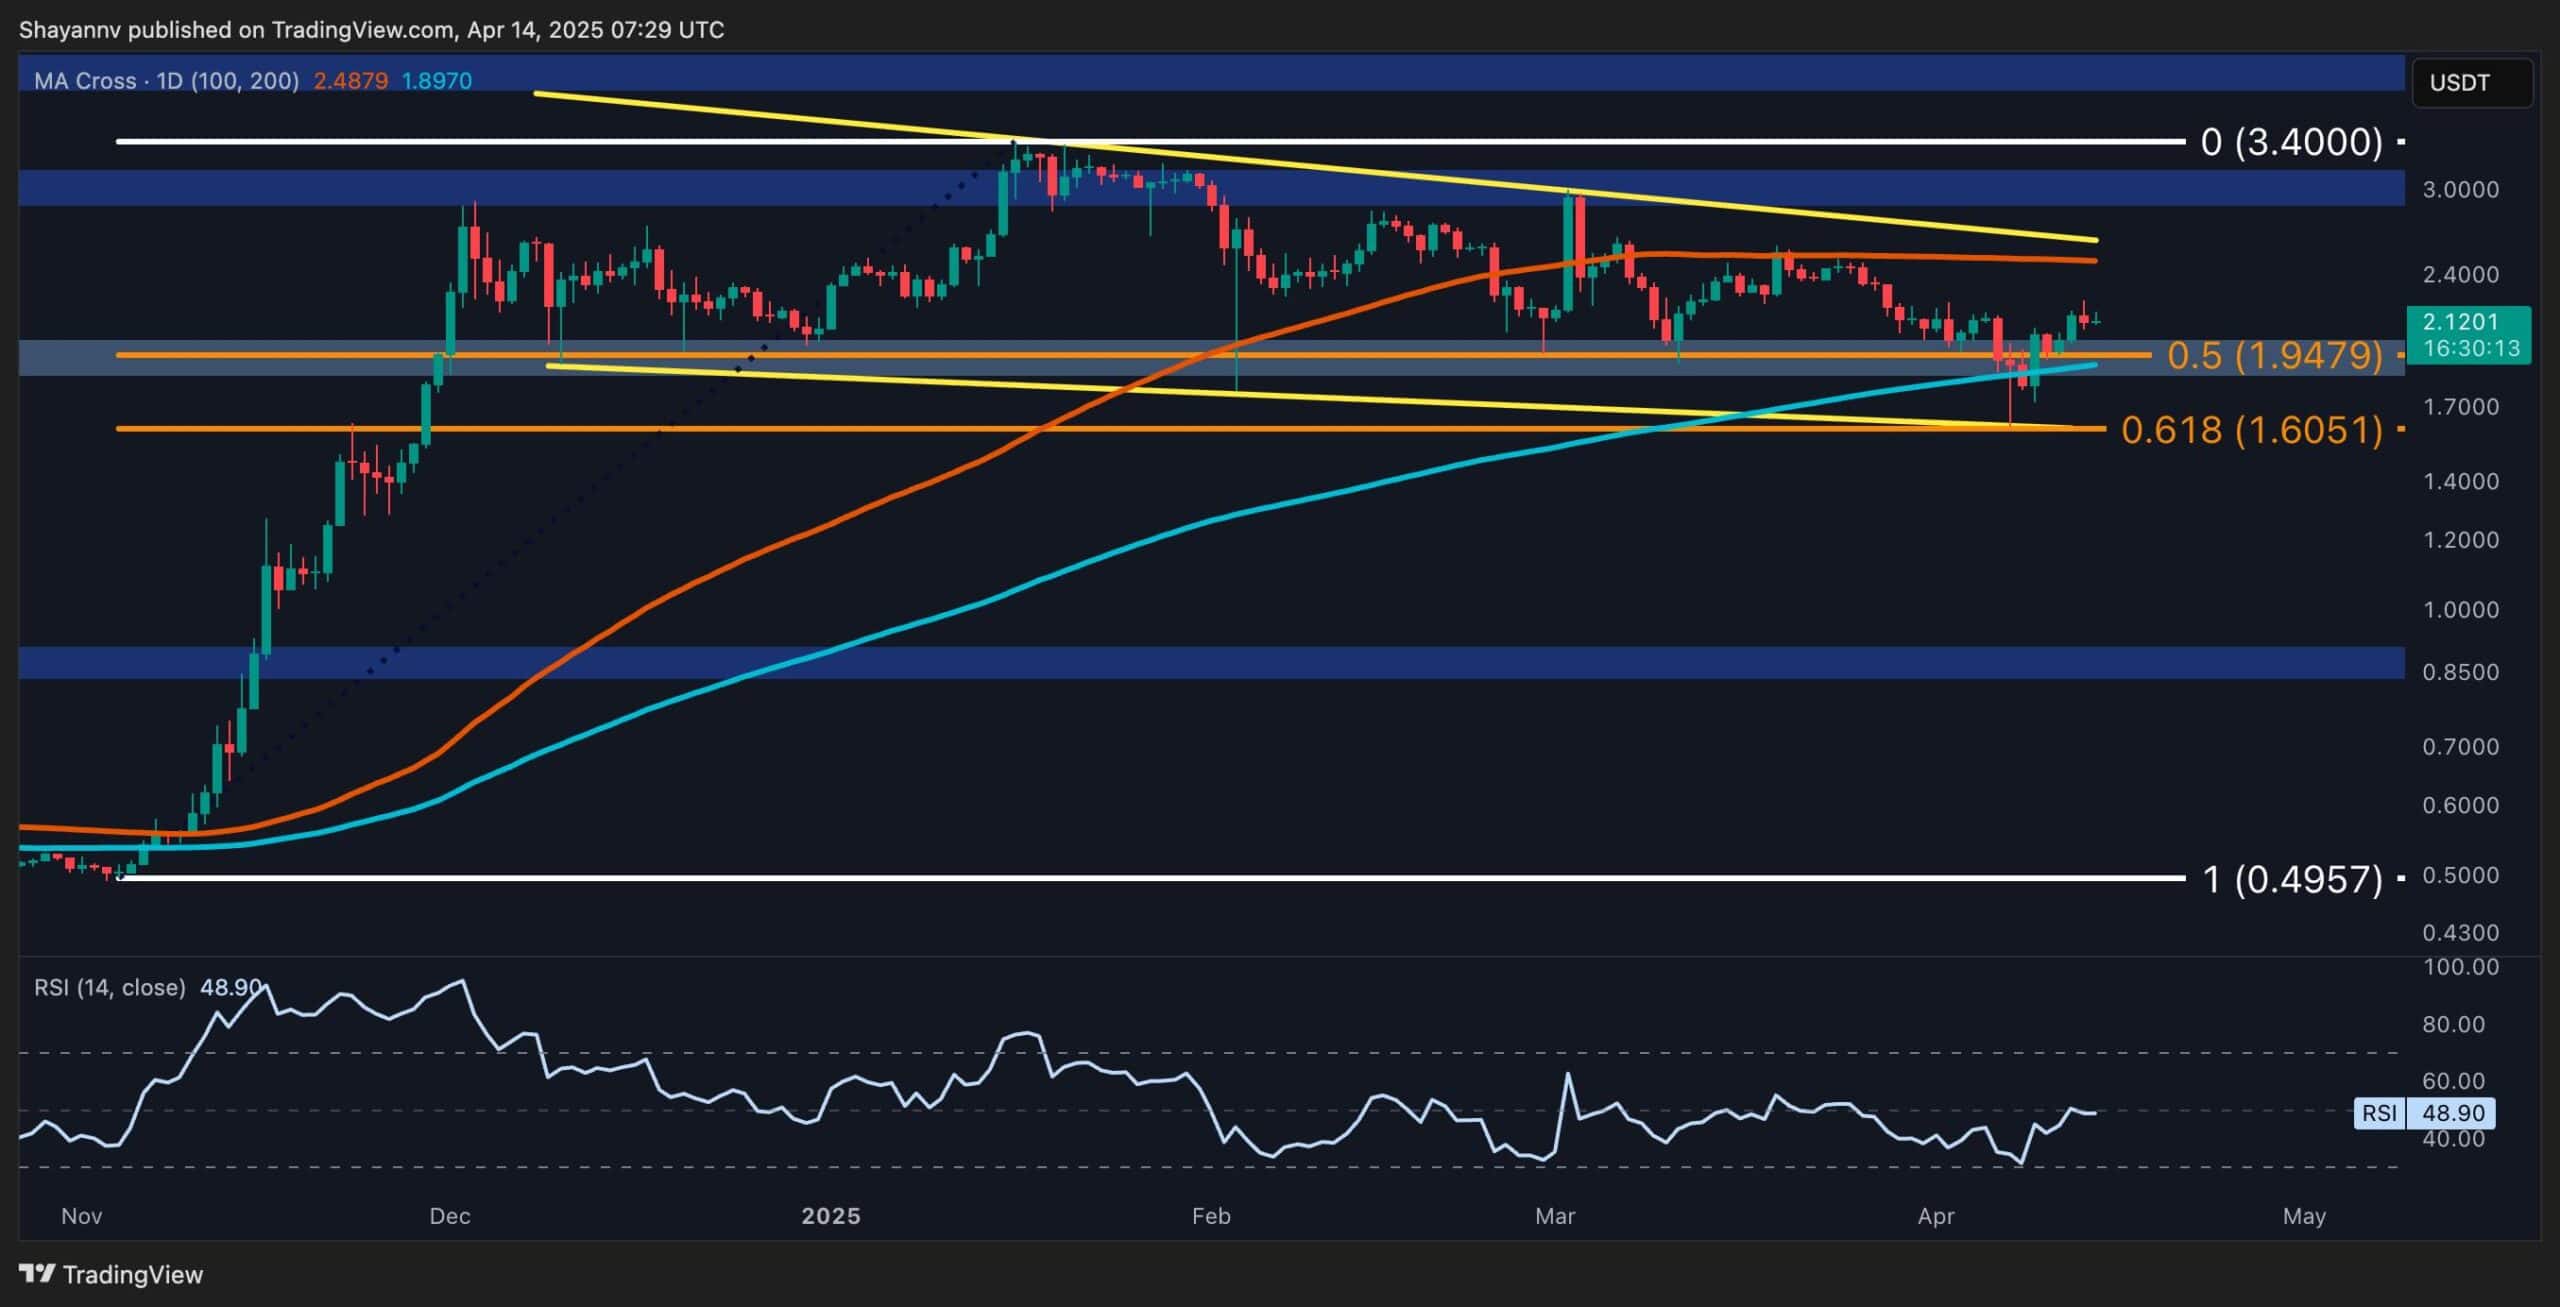
The 4-Hour Chart
On the lower timeframe, Ripple has invalidated a bearish breakout from the expanding wedge, reclaiming the pattern’s lower boundary in what appears to be a bear trap. This price action has attracted notable buying pressure, leading to a surge toward the critical $2.2 resistance, XRP’s previous swing high.
A confirmed breakout above $2.2 would result in a higher high and potentially signal a bullish market structure shift, paving the way for a rally toward the $2.5 resistance. However, if Ripple fails to surpass this key pivot, a retracement back to the $1.7 support zone remains a likely scenario.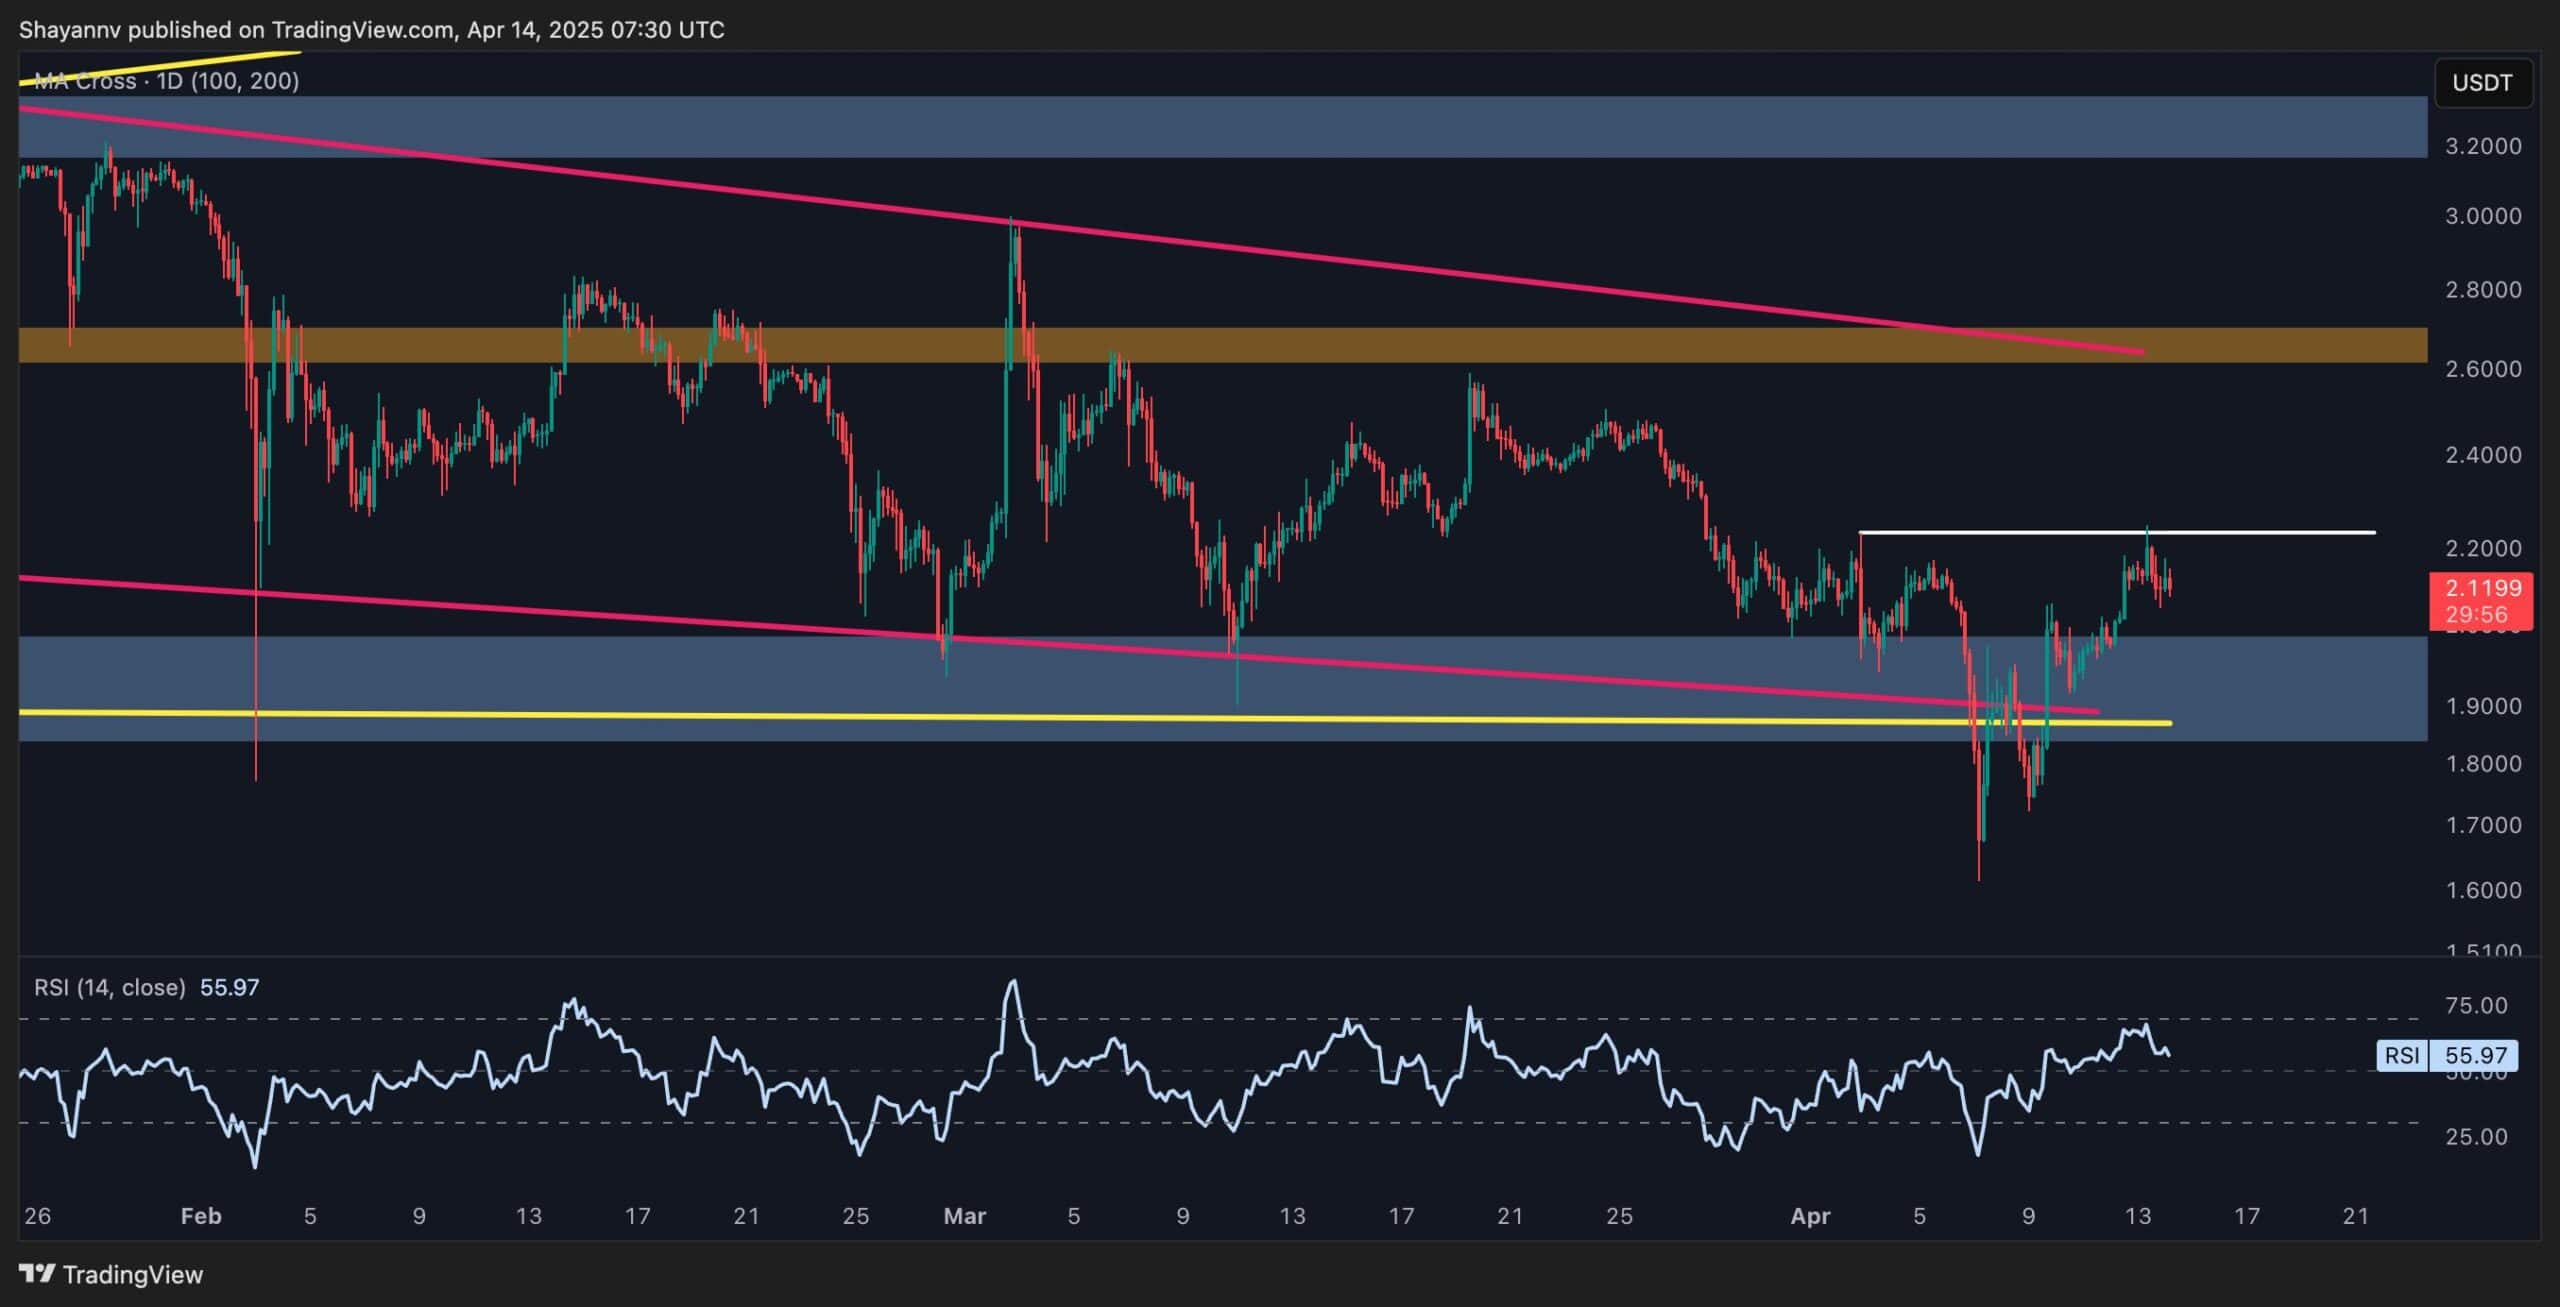
The post Ripple Price Analysis: XRP’s Outlook Following Rebound at $1.70 appeared first on CryptoPotato.
Read More


Is XRP in Trouble? Last Time This Happened Ripple’s Price Dumped by 25%
Ripple Price Analysis: XRP’s Outlook Following Rebound at $1.70
Ripple’s native token has staged a notable rebound from the crucial $1.7 support level, signaling renewed buying interest.
However, the price is now approaching a key resistance zone, where a breakout could trigger a bullish retracement toward the 100-day moving average at $2.5.
XRP Analysis
By Shayan
The Daily Chart
XRP managed to rebound from the crucial $1.7 support region, which aligns with the 200-day moving average and the 0.5–0.618 Fibonacci retracement range.
This confluence of support levels has triggered increased buying activity, temporarily halting the downtrend. Additionally, a bullish divergence between the price and the RSI suggests waning bearish momentum, increasing the likelihood of a potential trend reversal.
Despite the rebound, XRP remains trapped between the 100-day and 200-day moving averages, pointing toward a consolidation phase. Notably, the 100-day MA at $2.5 coincides with the upper boundary of a prolonged descending wedge pattern. A breakout above this level could confirm a bullish shift and initiate a fresh upward leg toward higher resistance zones.
The 4-Hour Chart
On the lower timeframe, Ripple has invalidated a bearish breakout from the expanding wedge, reclaiming the pattern’s lower boundary in what appears to be a bear trap. This price action has attracted notable buying pressure, leading to a surge toward the critical $2.2 resistance, XRP’s previous swing high.
A confirmed breakout above $2.2 would result in a higher high and potentially signal a bullish market structure shift, paving the way for a rally toward the $2.5 resistance. However, if Ripple fails to surpass this key pivot, a retracement back to the $1.7 support zone remains a likely scenario.
The post Ripple Price Analysis: XRP’s Outlook Following Rebound at $1.70 appeared first on CryptoPotato.
Read More