


Uniswap’s UNI Breaks Falling Wedge: Here’s Why $10-$11 Targets Are in Sight
- UNI price broke out of a long-term falling wedge pattern, signaling a shift to upward momentum.
- An inverse head and shoulders pattern near $7 neckline suggests a potential rise to $9 upon breakout.
Uniswap has recently recorded a price uptick after a consolidation that was coupled with varied market trends. During today’s Asian trading session, the cryptocurrency opened its market price at $6.6335 which has seen a continued surge, playing a role in its one-day 7% surge.
What is the Current Uniswap Market Performance?
Tracking the ongoing market trend as of press time, CoinMarketCap data indicates that the UNI token price stands at $7.11, reflecting a 7.45% increase over the past 24 hours. Following the positive movement, market cap reached $4.47 billion, reflecting the 7.45% rise as trading volume surged to $898.03 million, marking a 79.41% surge.

Additionally, the volume-to-market cap ratio currently sits at 19.54%, indicating active trading relative to market capitalization. The price chart displays price movements with prices fluctuating between $6.68 and $7.75. Price momentum shows a strong upward trend beginning early in the day, peaking near $7.75 before pulling back to around $7.12.
UNI Breaks Out of Long-Term Falling Wedge Pattern
The $UNI price chart demonstrates a breakout from a falling wedge pattern that began in late 2024. This pattern features a red downward-sloping resistance line and a green converging support line. After months of steady decline, $UNI reversed course around April 2025, breaking above the resistance line.

Following the breakout, $UNI price action formed a series of higher lows and higher highs. These movements confirm upward momentum in the short term. The current price sits near $6.5, supported by the price’s position above the exponential moving average (EMA). This EMA lies below current prices, which often signals further upward potential.
An orange projected path on the chart points toward target price levels of $10 to $11. These targets correspond with resistance zones from mid-2024 price peaks, suggesting a possible return to earlier price points in the short term.
Inverse Head and Shoulders Pattern Fuels Momentum
The expected uptick in UNI does not rely on the recent breakout alone. Another technical analysis by CryptosBatman hints at more to validate the bullish momentum. The UNI/USDT pair on Binance displays a clear inverse head and shoulders pattern on the 2-day chart. The left shoulder formed with a rounded bottom in mid-March, followed by a deeper low—the head—in early April. The right shoulder appeared in mid-May, forming a higher low. The neckline resistance level is near $7, marked by two horizontal lines.

The price has tested this neckline multiple times with increasing momentum. A breakout above the neckline often signals a trend reversal to bullish momentum. Projection lines suggest a potential rise to $9 after breaking the neckline. This setup matches common price consolidations where prices stabilize before upward moves. The 2-day timeframe reveals medium-term behavior, showing readiness for a possible breakout.
Highlighted Crypto News Today:
Read More
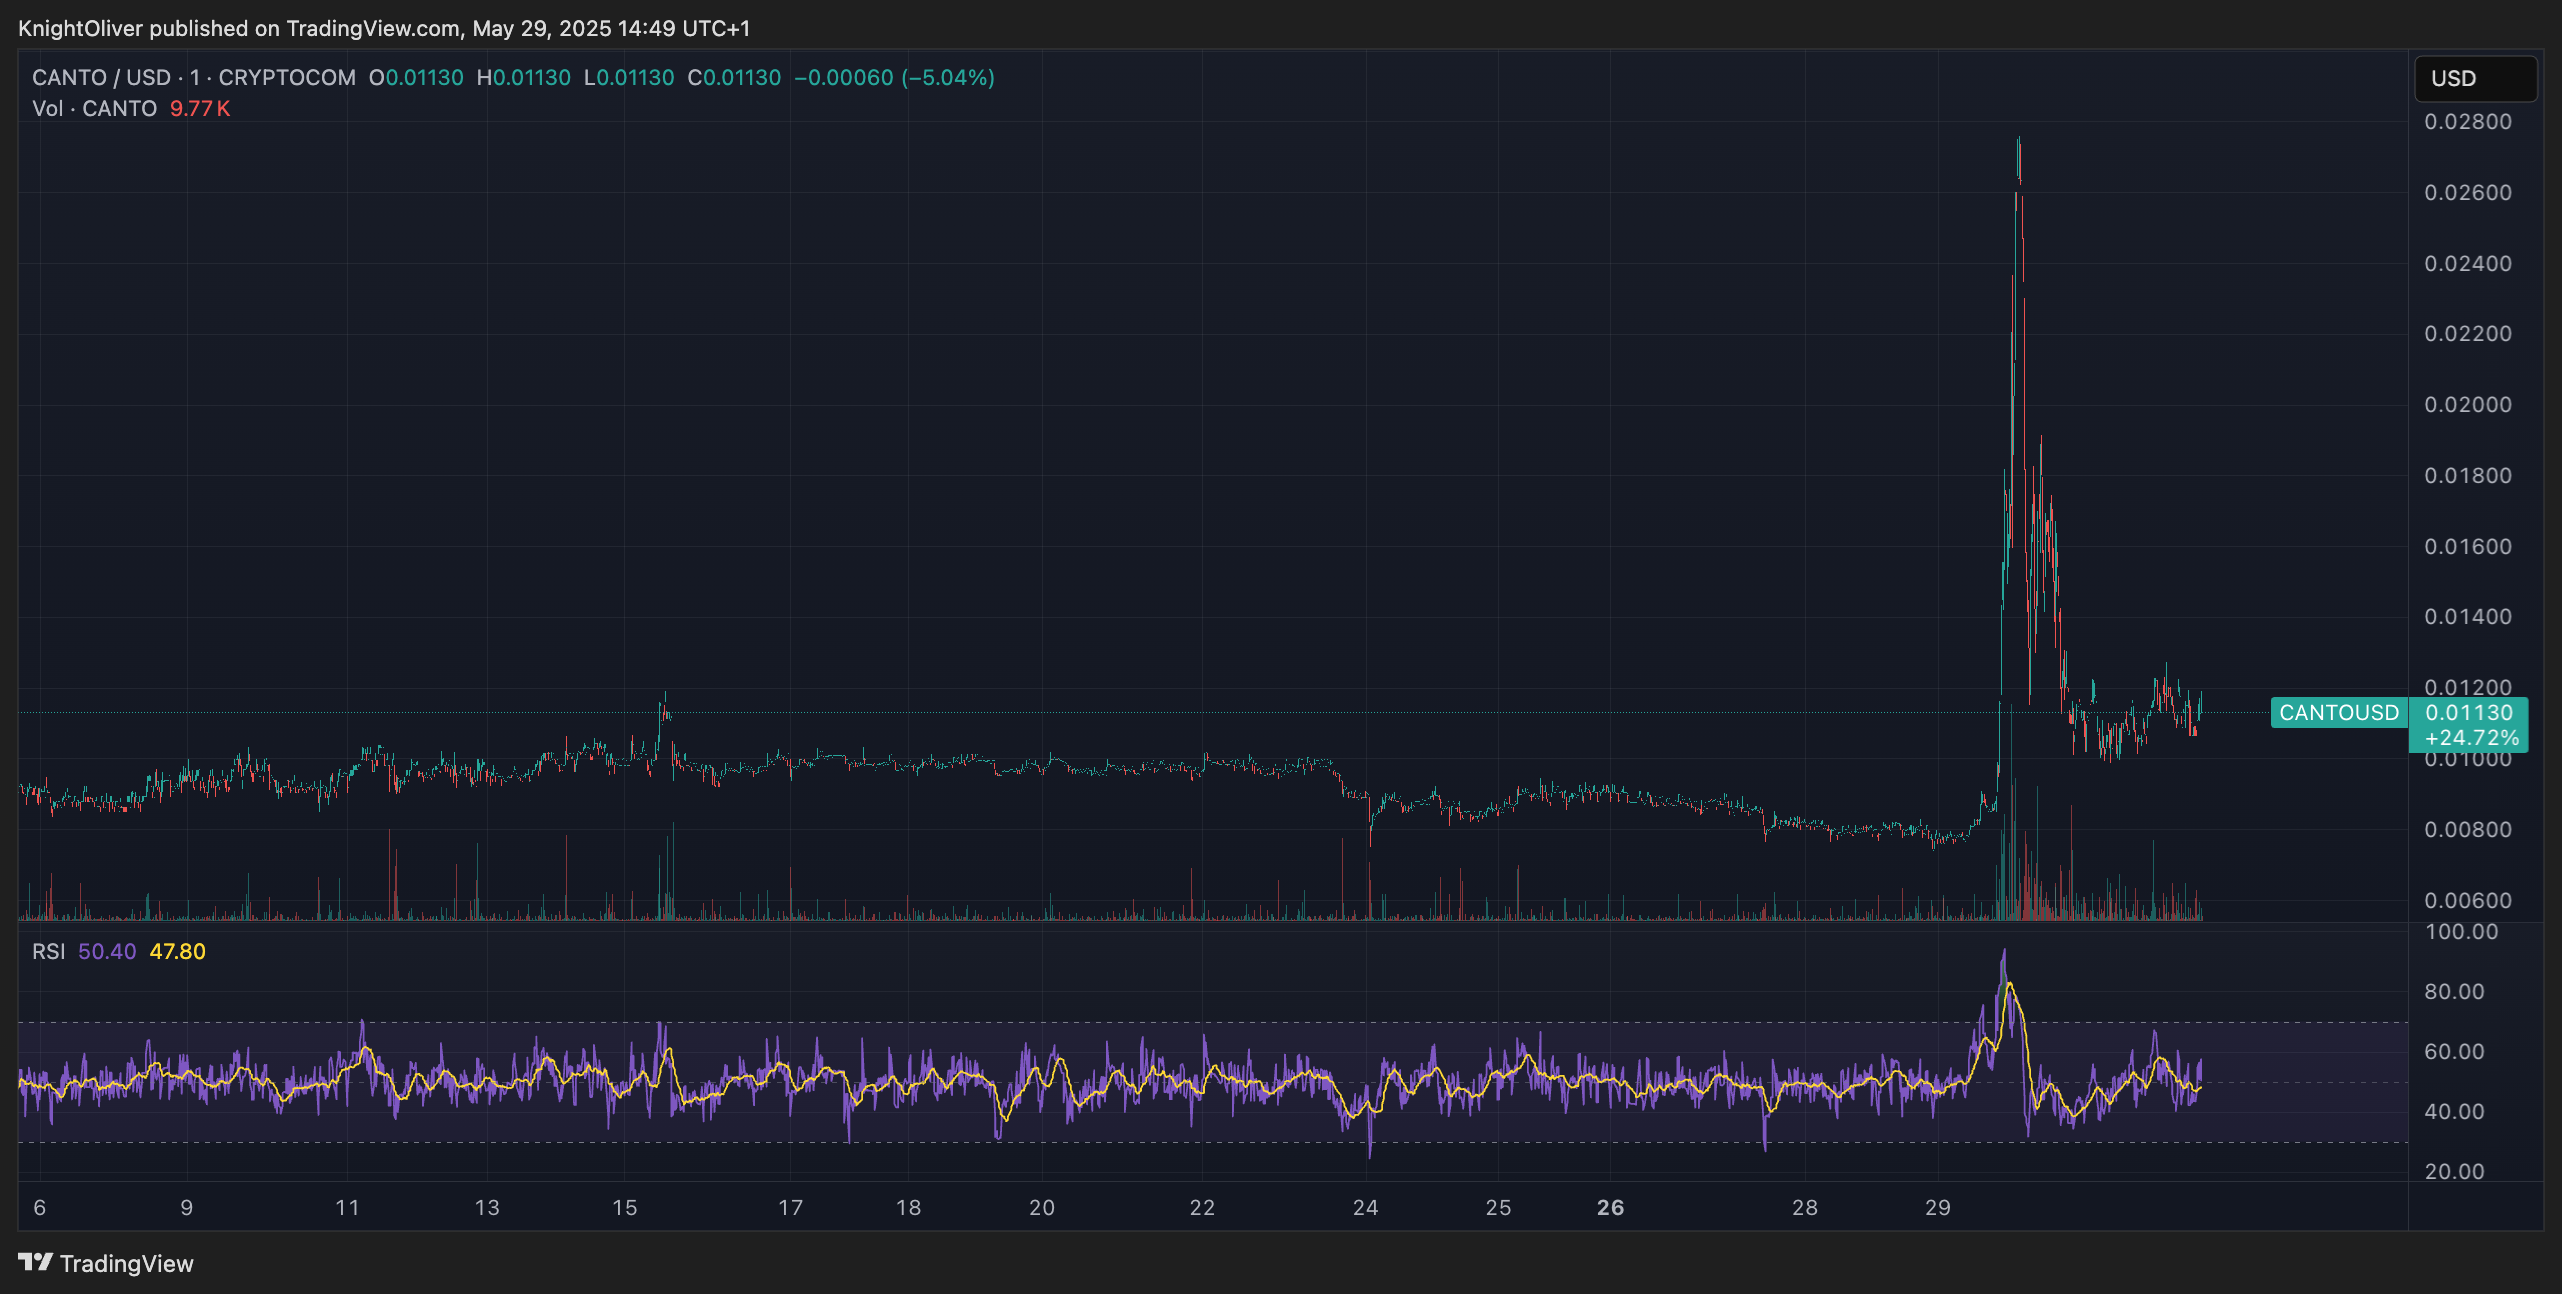
CANTO Rises From the Ashes, Spiking 250% Before Crashing Back Down

SPX6900 (SPX) Price Surges 15%, Eyeing $2.00 Mark
Uniswap’s UNI Breaks Falling Wedge: Here’s Why $10-$11 Targets Are in Sight
- UNI price broke out of a long-term falling wedge pattern, signaling a shift to upward momentum.
- An inverse head and shoulders pattern near $7 neckline suggests a potential rise to $9 upon breakout.
Uniswap has recently recorded a price uptick after a consolidation that was coupled with varied market trends. During today’s Asian trading session, the cryptocurrency opened its market price at $6.6335 which has seen a continued surge, playing a role in its one-day 7% surge.
What is the Current Uniswap Market Performance?
Tracking the ongoing market trend as of press time, CoinMarketCap data indicates that the UNI token price stands at $7.11, reflecting a 7.45% increase over the past 24 hours. Following the positive movement, market cap reached $4.47 billion, reflecting the 7.45% rise as trading volume surged to $898.03 million, marking a 79.41% surge.
Additionally, the volume-to-market cap ratio currently sits at 19.54%, indicating active trading relative to market capitalization. The price chart displays price movements with prices fluctuating between $6.68 and $7.75. Price momentum shows a strong upward trend beginning early in the day, peaking near $7.75 before pulling back to around $7.12.
UNI Breaks Out of Long-Term Falling Wedge Pattern
The $UNI price chart demonstrates a breakout from a falling wedge pattern that began in late 2024. This pattern features a red downward-sloping resistance line and a green converging support line. After months of steady decline, $UNI reversed course around April 2025, breaking above the resistance line.
Following the breakout, $UNI price action formed a series of higher lows and higher highs. These movements confirm upward momentum in the short term. The current price sits near $6.5, supported by the price’s position above the exponential moving average (EMA). This EMA lies below current prices, which often signals further upward potential.
An orange projected path on the chart points toward target price levels of $10 to $11. These targets correspond with resistance zones from mid-2024 price peaks, suggesting a possible return to earlier price points in the short term.
Inverse Head and Shoulders Pattern Fuels Momentum
The expected uptick in UNI does not rely on the recent breakout alone. Another technical analysis by CryptosBatman hints at more to validate the bullish momentum. The UNI/USDT pair on Binance displays a clear inverse head and shoulders pattern on the 2-day chart. The left shoulder formed with a rounded bottom in mid-March, followed by a deeper low—the head—in early April. The right shoulder appeared in mid-May, forming a higher low. The neckline resistance level is near $7, marked by two horizontal lines.
The price has tested this neckline multiple times with increasing momentum. A breakout above the neckline often signals a trend reversal to bullish momentum. Projection lines suggest a potential rise to $9 after breaking the neckline. This setup matches common price consolidations where prices stabilize before upward moves. The 2-day timeframe reveals medium-term behavior, showing readiness for a possible breakout.
Highlighted Crypto News Today:
Read More
CANTO Rises From the Ashes, Spiking 250% Before Crashing Back Down