
Ethereum Price Analysis: Is ETH’s $2K Dream Dead After the Latest Rejection?
Share:
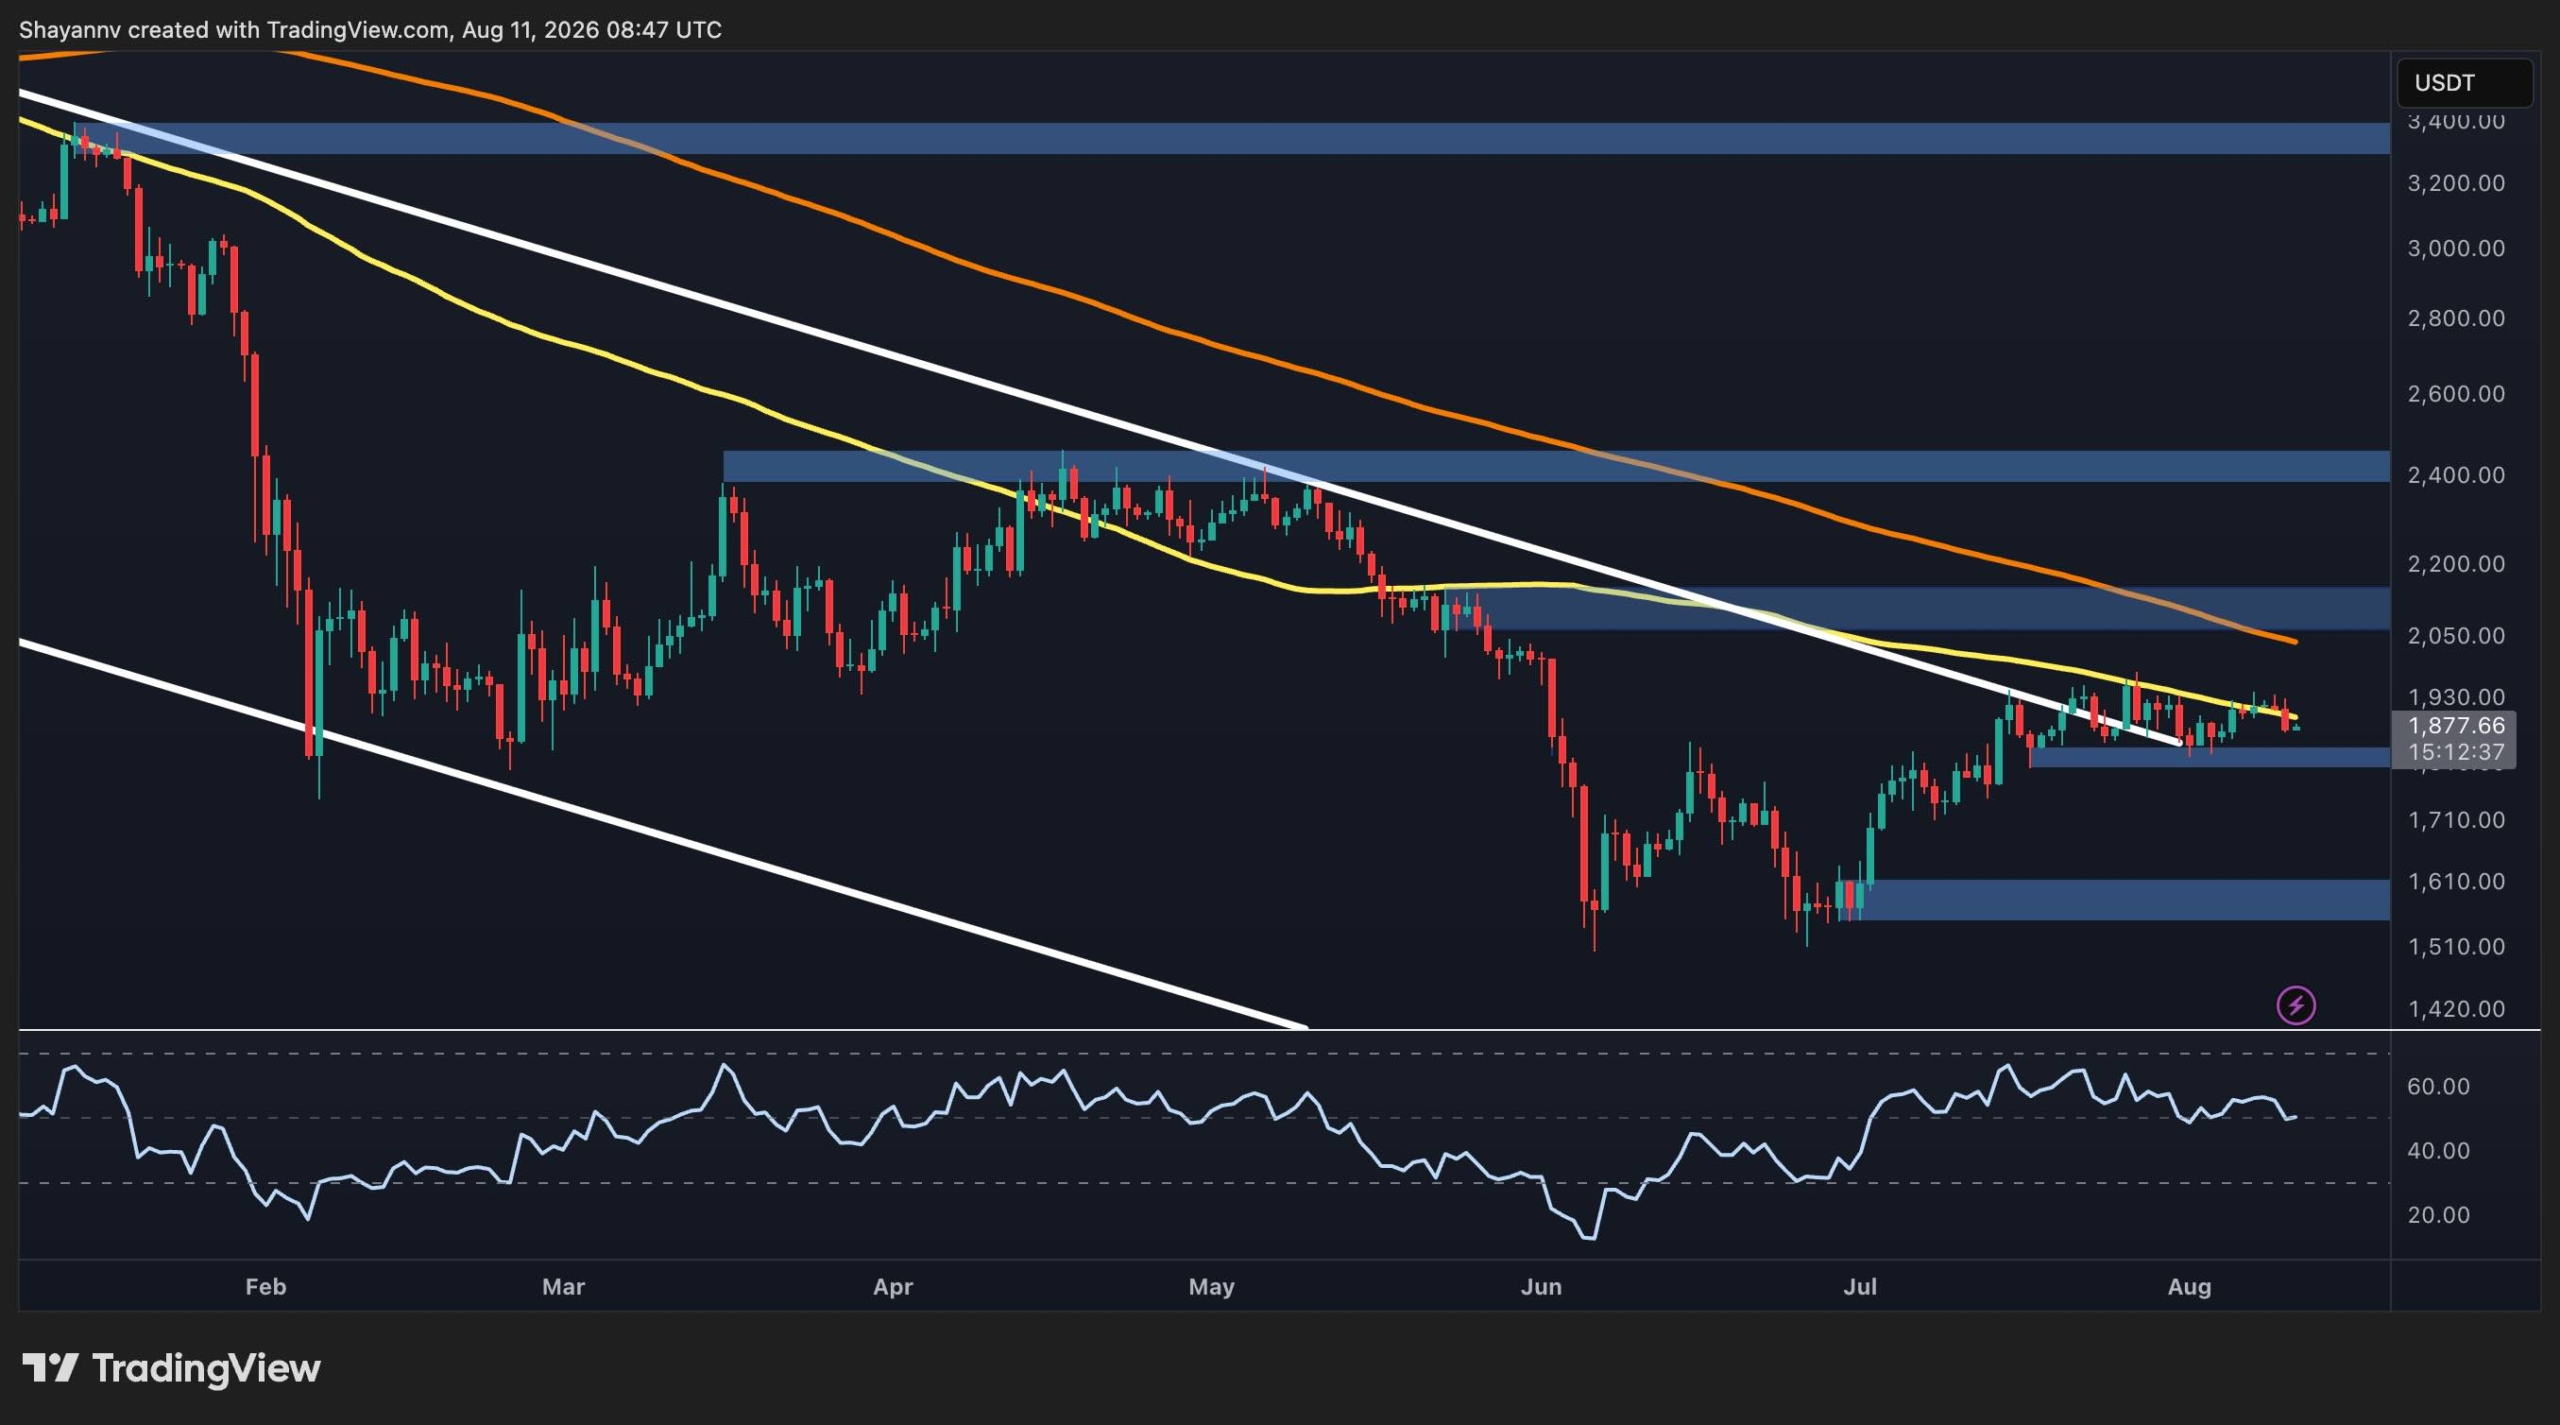
Ethereum is consolidating around $1.8K–$1.88K after recovering from June lows, but the daily structure remains under pressure with a series of lower highs since the earlier 2026 peak and price trading below key moving averages and a descending trendline. The 100-day moving average near $1.9K is a near-term resistance while a continued decline in exchange supply ratio points to shrinking ETH on CEXs, a supply-side positive for crypto adoption and DeFi liquidity.
Predictions Markets
See what traders are focused on

Ethereum is consolidating around the $1.8K area after recovering from its June lows, but the broader structure remains under pressure. The daily chart shows ETH trading below important moving averages, while the 4-hour chart suggests that the recent recovery has entered a range. Meanwhile, the exchange supply ratio has continued to decline, pointing to a shrinking amount of ETH held on exchanges.
Ethereum Price Analysis: The Daily Chart
ETH is currently trading around $1.88K, with the daily structure still characterized by a series of lower highs from the earlier 2026 peak. The price remains below the descending white trendline, which has acted as dynamic resistance, as well as below the higher moving averages shown on the chart. The 100-day moving average is currently around $1.9K, making the region an important near-term resistance zone.


