Polkadot Price Analysis: Here Are the Critical Levels to Watch Following 8% Weekly Drop
Share:
Predictions Markets
See what traders are focused on

Polkadot’s price has faced significant selling pressure, leading to a notable plunge below the crucial $6 support region. The price action suggests a potential continuation of the downtrend in the short term, with no signs of recovery currently evident.
Technical Analysis
By Shayan
The Daily Chart
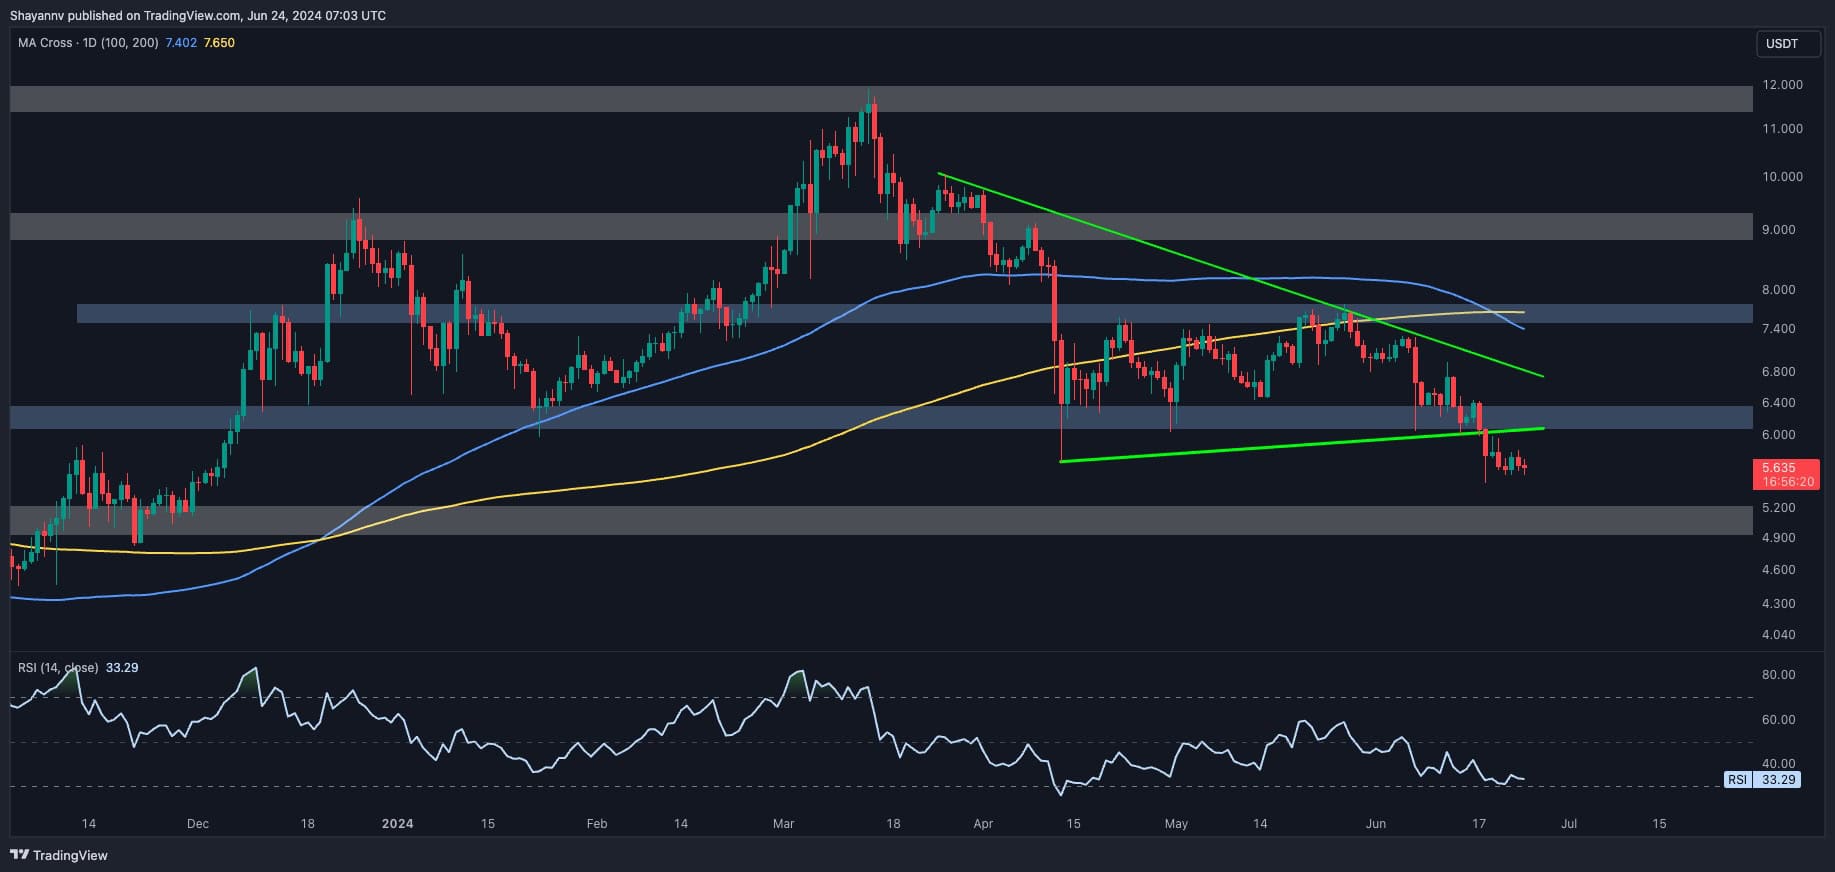
The daily chart shows a significant increase in selling momentum, which has driven Polkadot’s price below the critical $6 support level and out of a multi-month triangle pattern. This breach has triggered a substantial long liquidation event.
The price displays no signs of recovery on the daily timeframe, indicating the possibility of a continued downtrend. However, a slight and temporary pullback to the broken $6 threshold could occur, confirming the breakout and solidifying the bearish scenario.
Key Levels to Watch:
- Primary Target: The substantial support region at $5.
- Resistance: The significant resistance at $6.
Traders should exercise caution as the market may experience heightened volatility and notable fluctuations in the short term.
The 4-Hour Chart
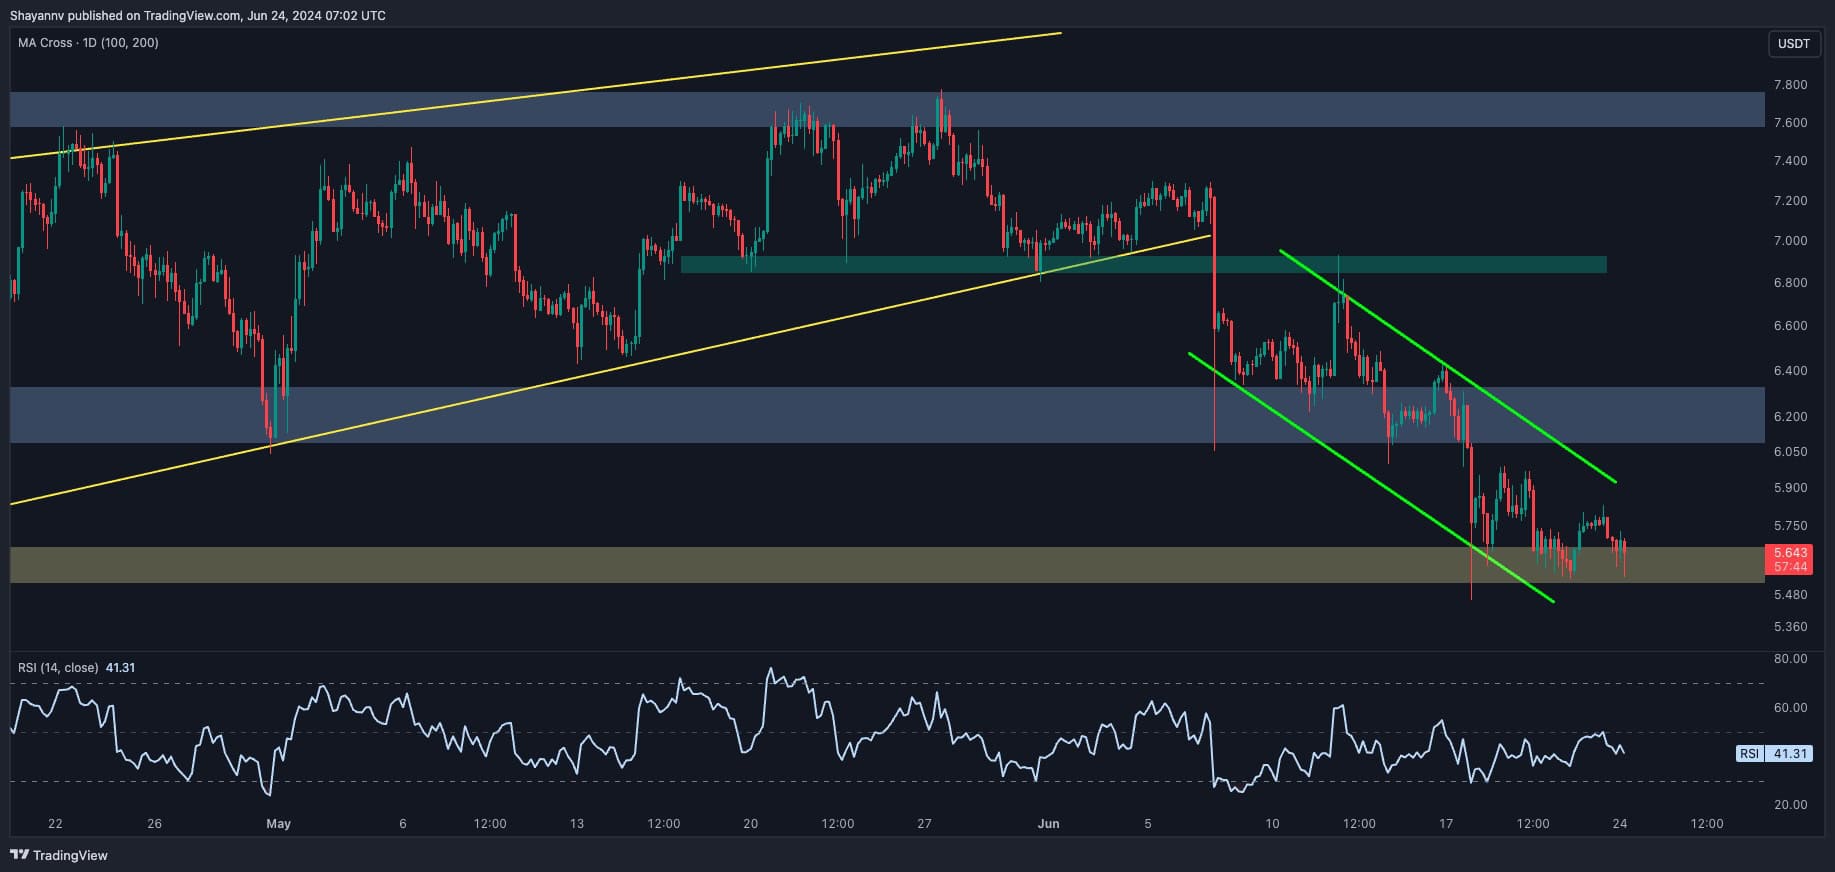
On the 4-hour chart, Polkadot’s price action shows a clear pattern of lower lows and lower highs, indicative of a pronounced downtrend and ongoing seller dominance.
The cryptocurrency is retracing within a bearish price channel, underscoring continued selling interest among market participants. Despite the downtrend, the price has approached a crucial support area of around $5.5, which is historically significant as support in multiple instances.
If selling pressure intensifies and breaches the $5.5 support level, Polkadot could see further downside, targeting the substantial $5 support zone.
Alternatively, a scenario of temporary consolidation near this pivotal support is plausible, with price movements confined between the $5.5 support and the upper boundary of the descending channel.
Sentiment Analysis
By Shayan
Polkadot has been in a strong downtrend over the past few weeks, ultimately falling below the critical $6 threshold. Understanding the key drivers of this bearish movement is essential for traders to gauge market sentiment and anticipate future price action.
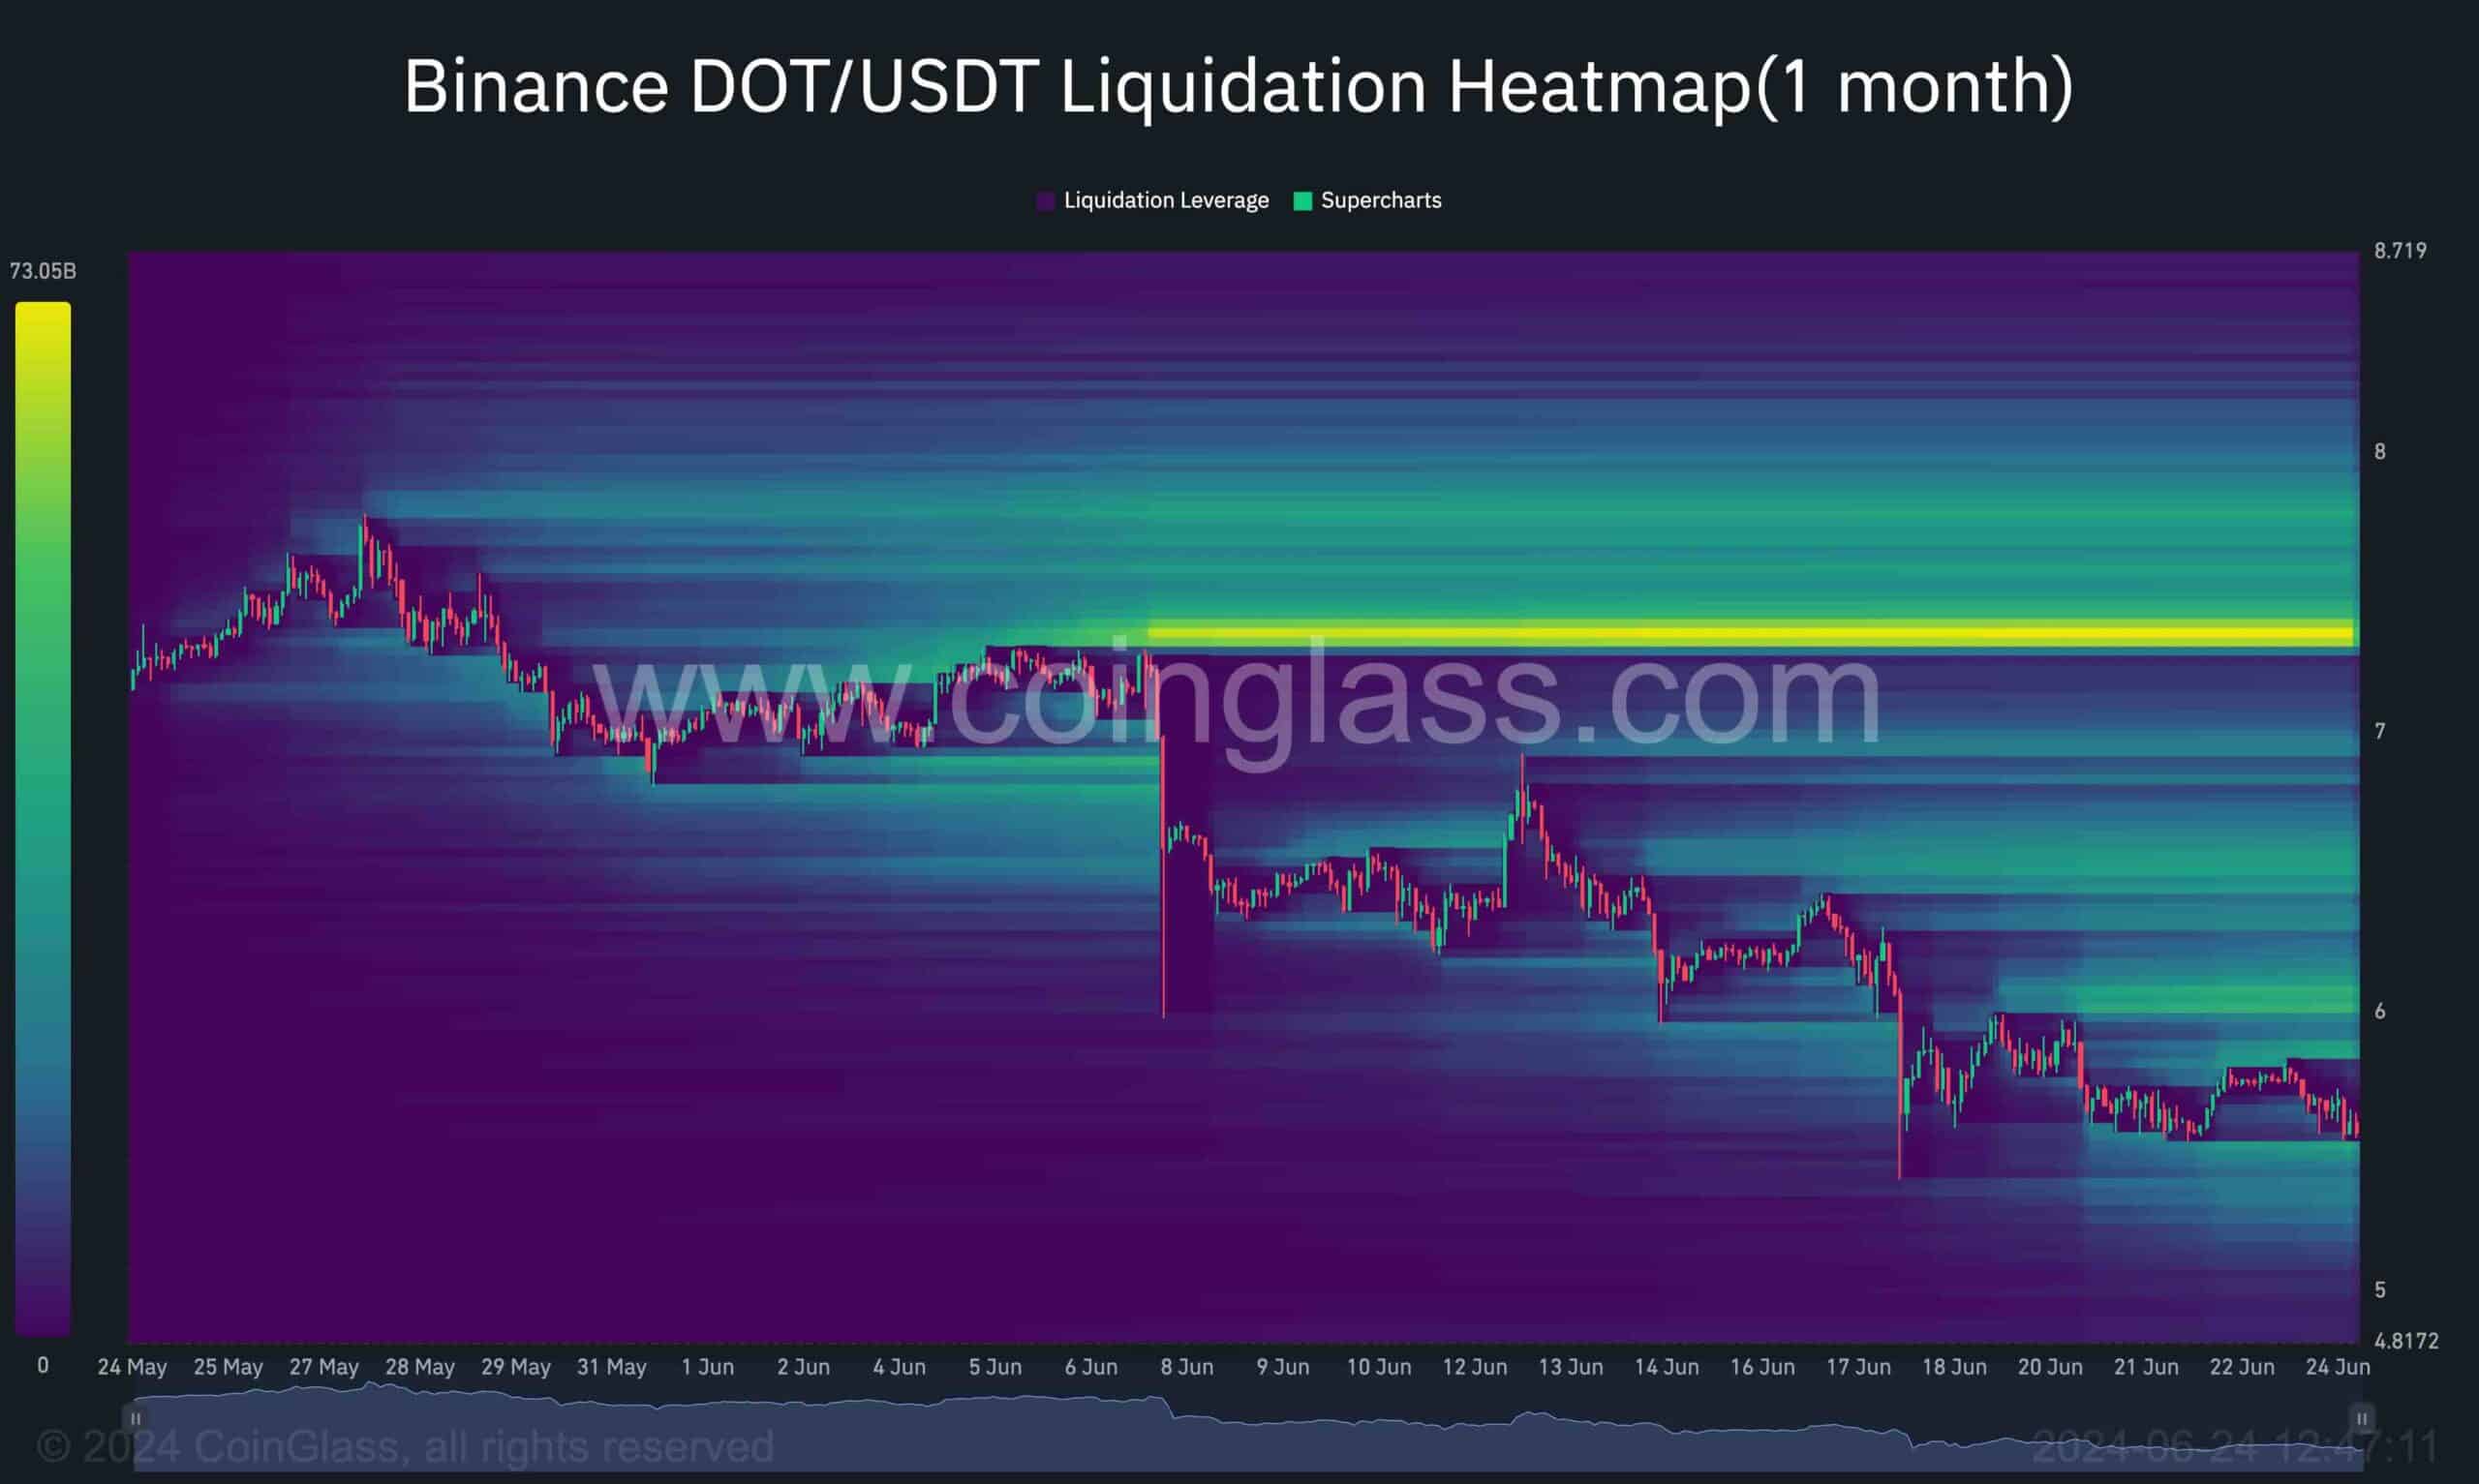
The accompanying chart highlights the potential liquidation levels in Polkadot’s price action, which can provide valuable insights into the focus areas for smart money in the mid-term.
A significant amount of liquidity is positioned above the major swing high of $7.3, where the current impulsive bearish trend began. This area is likely filled with buy-stop orders, indicating substantial selling activity and aggressive short positions.
These liquidity pools above $7.3 signal a strong bearish sentiment in the market. Despite the ongoing downtrend, sellers will eventually need to realize their profits. This often leads to periods of consolidation and potential bullish retracements.
The post Polkadot Price Analysis: Here Are the Critical Levels to Watch Following 8% Weekly Drop appeared first on CryptoPotato.


Read More

Oil is back near $90, so why is Bitcoin still above $66,000?