Ethereum’s (ETH) Weekly Chart Reveals Possible $3K Target

- Breakout patterns on ETH’s weekly chart suggested that the altcoin may rise to $3K in the next few months.
- If these patterns are validated, the altcoin’s price may enter into a rally between the end of this year and Q1 of 2024.
- According to CoinMarketCap, ETH’s price dropped 2.40% in the past 24 hours, which left it trading at $1,575.07.
ETH’s short-term performance has been poor, to say the least. The altcoin leader’s price dropped over the past 24 hours, which also pushed its weekly and monthly performances further into the red zone. Despite this short-term bearish momentum, break-out patterns on ETH’s weekly chart suggested that the altcoin may rise to $3K in the next few months.
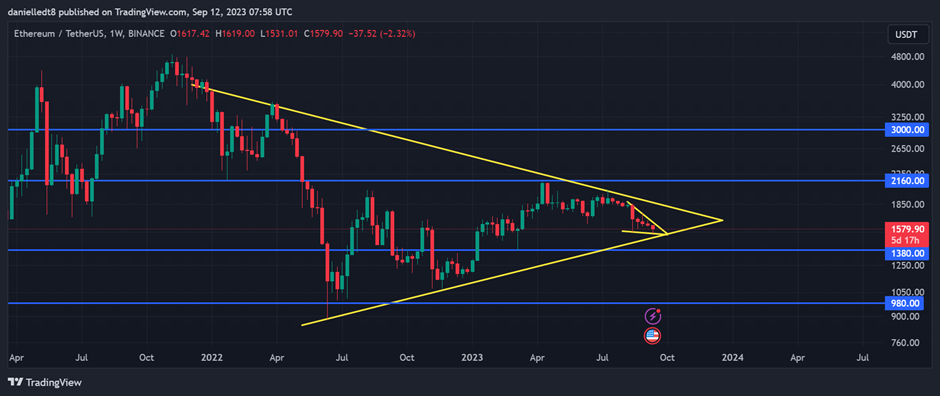
Investors and traders will want to take note of the 2 break-out patterns that have formed on ETH’s weekly chart. Zooming out on the chart revealed that a symmetrical triangle chart pattern formed on ETH’s weekly chart over the past few months. This suggested that the altcoin’s price may enter into a rally between the end of this year and Q1 of 2024.
Also Read: Ethereum Price Prediction
If this breakout is towar…
The post Ethereum’s (ETH) Weekly Chart Reveals Possible $3K Target appeared first on Coin Edition.
Read More

Ethereum (ETH) Price Prediction For June 25
Ethereum (ETH) Price Prediction for June 24, 2025
Ethereum’s (ETH) Weekly Chart Reveals Possible $3K Target
- Breakout patterns on ETH’s weekly chart suggested that the altcoin may rise to $3K in the next few months.
- If these patterns are validated, the altcoin’s price may enter into a rally between the end of this year and Q1 of 2024.
- According to CoinMarketCap, ETH’s price dropped 2.40% in the past 24 hours, which left it trading at $1,575.07.
ETH’s short-term performance has been poor, to say the least. The altcoin leader’s price dropped over the past 24 hours, which also pushed its weekly and monthly performances further into the red zone. Despite this short-term bearish momentum, break-out patterns on ETH’s weekly chart suggested that the altcoin may rise to $3K in the next few months.
Investors and traders will want to take note of the 2 break-out patterns that have formed on ETH’s weekly chart. Zooming out on the chart revealed that a symmetrical triangle chart pattern formed on ETH’s weekly chart over the past few months. This suggested that the altcoin’s price may enter into a rally between the end of this year and Q1 of 2024.
Also Read: Ethereum Price Prediction
If this breakout is towar…
The post Ethereum’s (ETH) Weekly Chart Reveals Possible $3K Target appeared first on Coin Edition.
Read More
Ethereum (ETH) Price Prediction For June 25