


Is ETH in Danger of Falling to $3K or Will the Bulls Wake Up? (Ethereum Price Analysis)
Ethereum’s price has landed on a decisive and substantial support region following a brief consolidation correction stage, with potential for a bullish reversal.
However, if Ethereum sellers breach this pivot, a cascade in the market is likely.
Technical Analysis
By Shayan
The Daily Chart
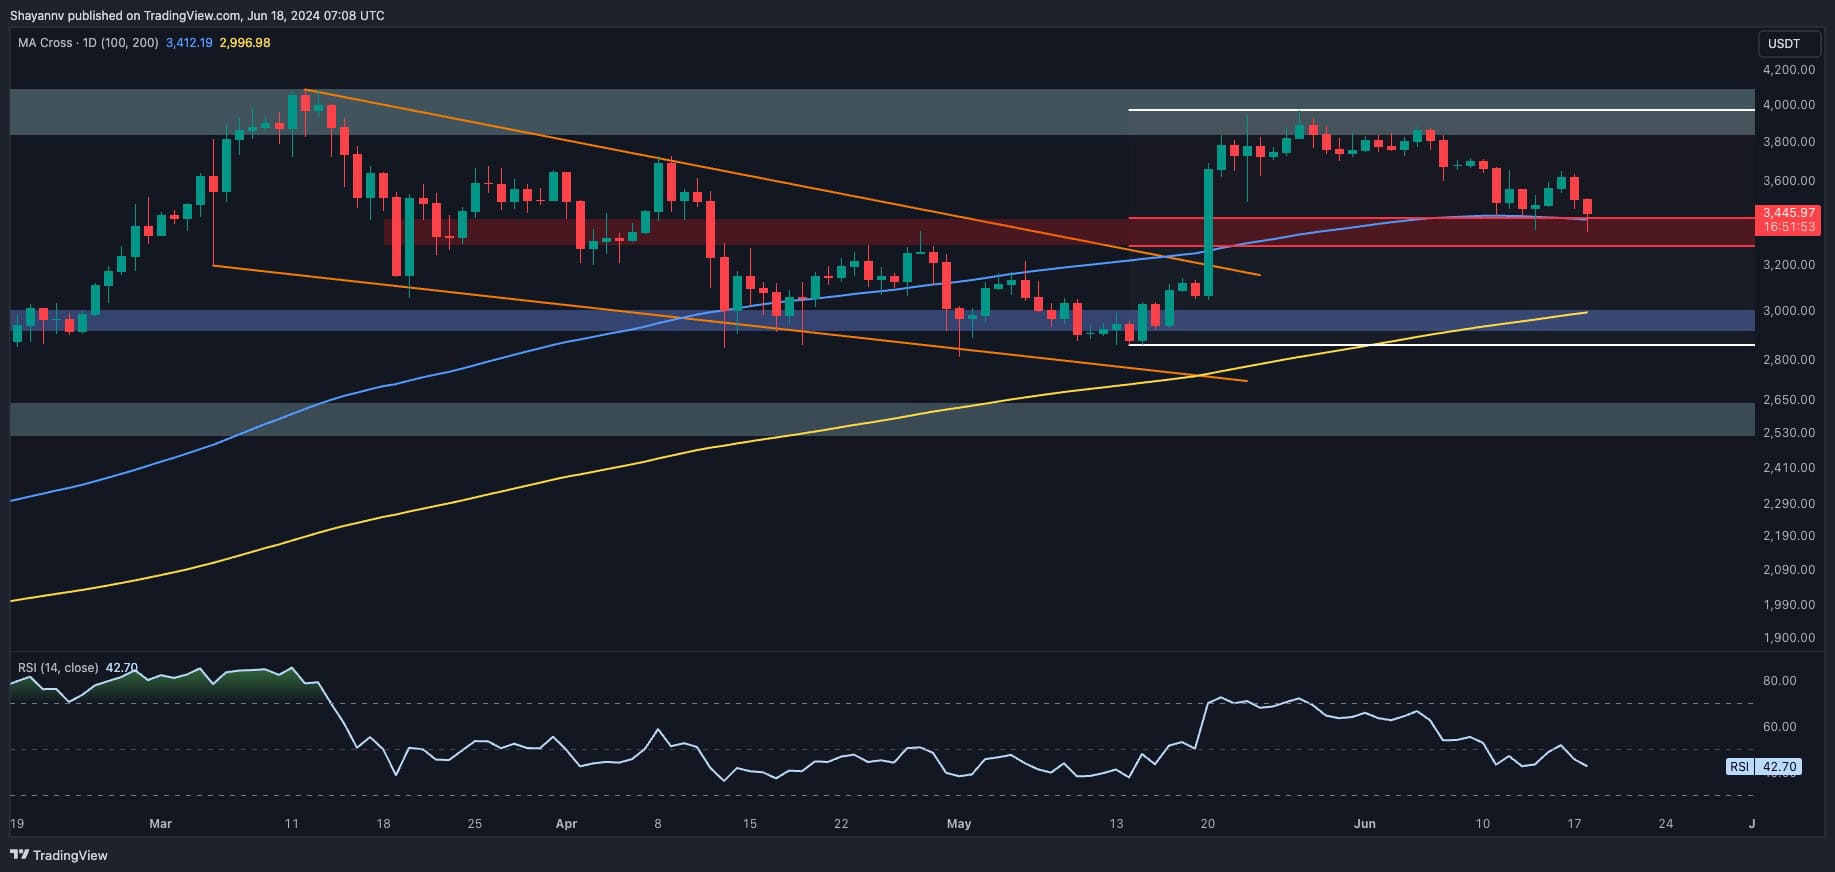
A closer look at the daily chart shows that Ethereum has reached a pivotal support region after a brief consolidation correction stage. This region encompasses the price range between the 0.5 ($3421) and 0.618 ($3289) Fibonacci levels, aligning with the substantial support of the 100-day moving average ($3412). T
The alignment of these support indicators highlights the strength of this critical level and the prevailing demand at this juncture, which could halt further downward pressure.
A battle between buyers and sellers is expected at this pivotal price range, leading to heightened market volatility and potential liquidations. The outcome will likely determine Ethereum’s upcoming trend. If sellers overcome buyers and breach this crucial support region, a cascade toward the 200-day moving average at $2996 will be imminent.
The 4-Hour Chart
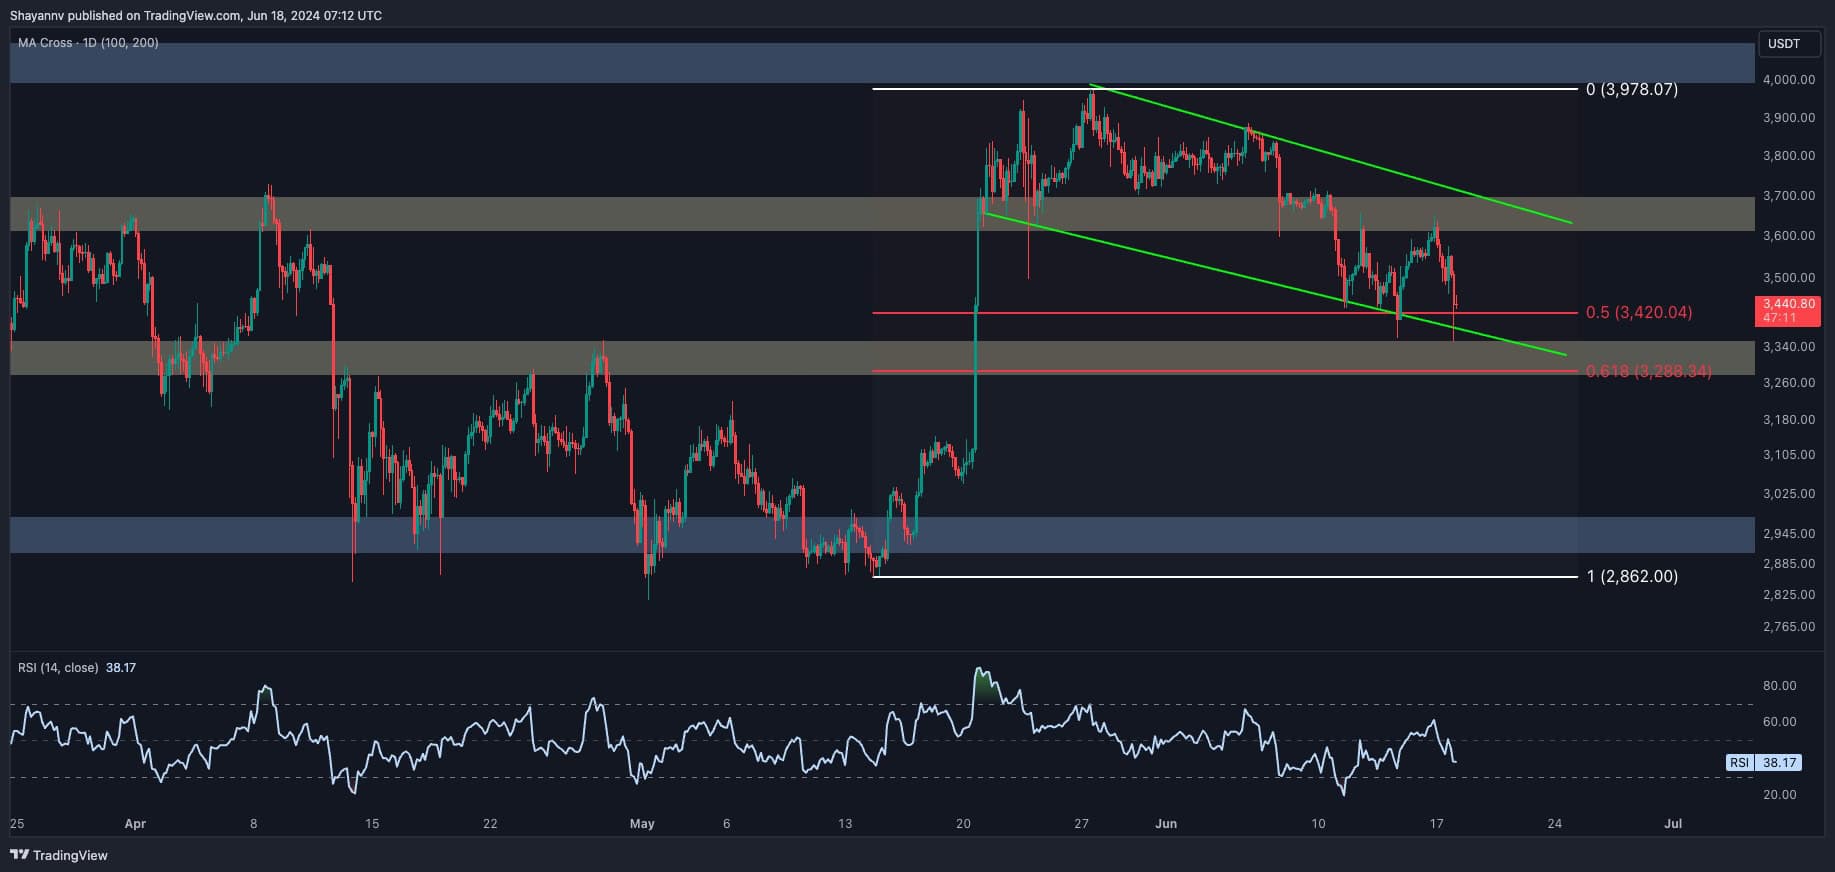
On the 4-hour chart, Ethereum formed a head and shoulders pattern, resulting in increased selling activity and a break below the pattern’s neckline.
This development and a bearish divergence between the price and the RSI indicator have heightened bearish momentum, leading to a significant downward movement. Following this, Ethereum has formed a descending flag pattern, a well-known bullish continuation pattern if breached from the upper boundary.
Currently, the price is hovering around a critical and decisive support region marked by the 0.5 ($3420) to 0.618 ($3289) Fibonacci retracement levels and the flag’s lower boundary. This area is experiencing intensified volatility and fluctuations.
If sellers break down this crucial support, an impulsive downtrend targeting the $2.9K support is expected. Conversely, if sufficient demand returns and shrinks the existing supply, a reversal towards the flag’s upper boundary at $3.6K will likely occur.
Sentiment Analysis
By Shayan
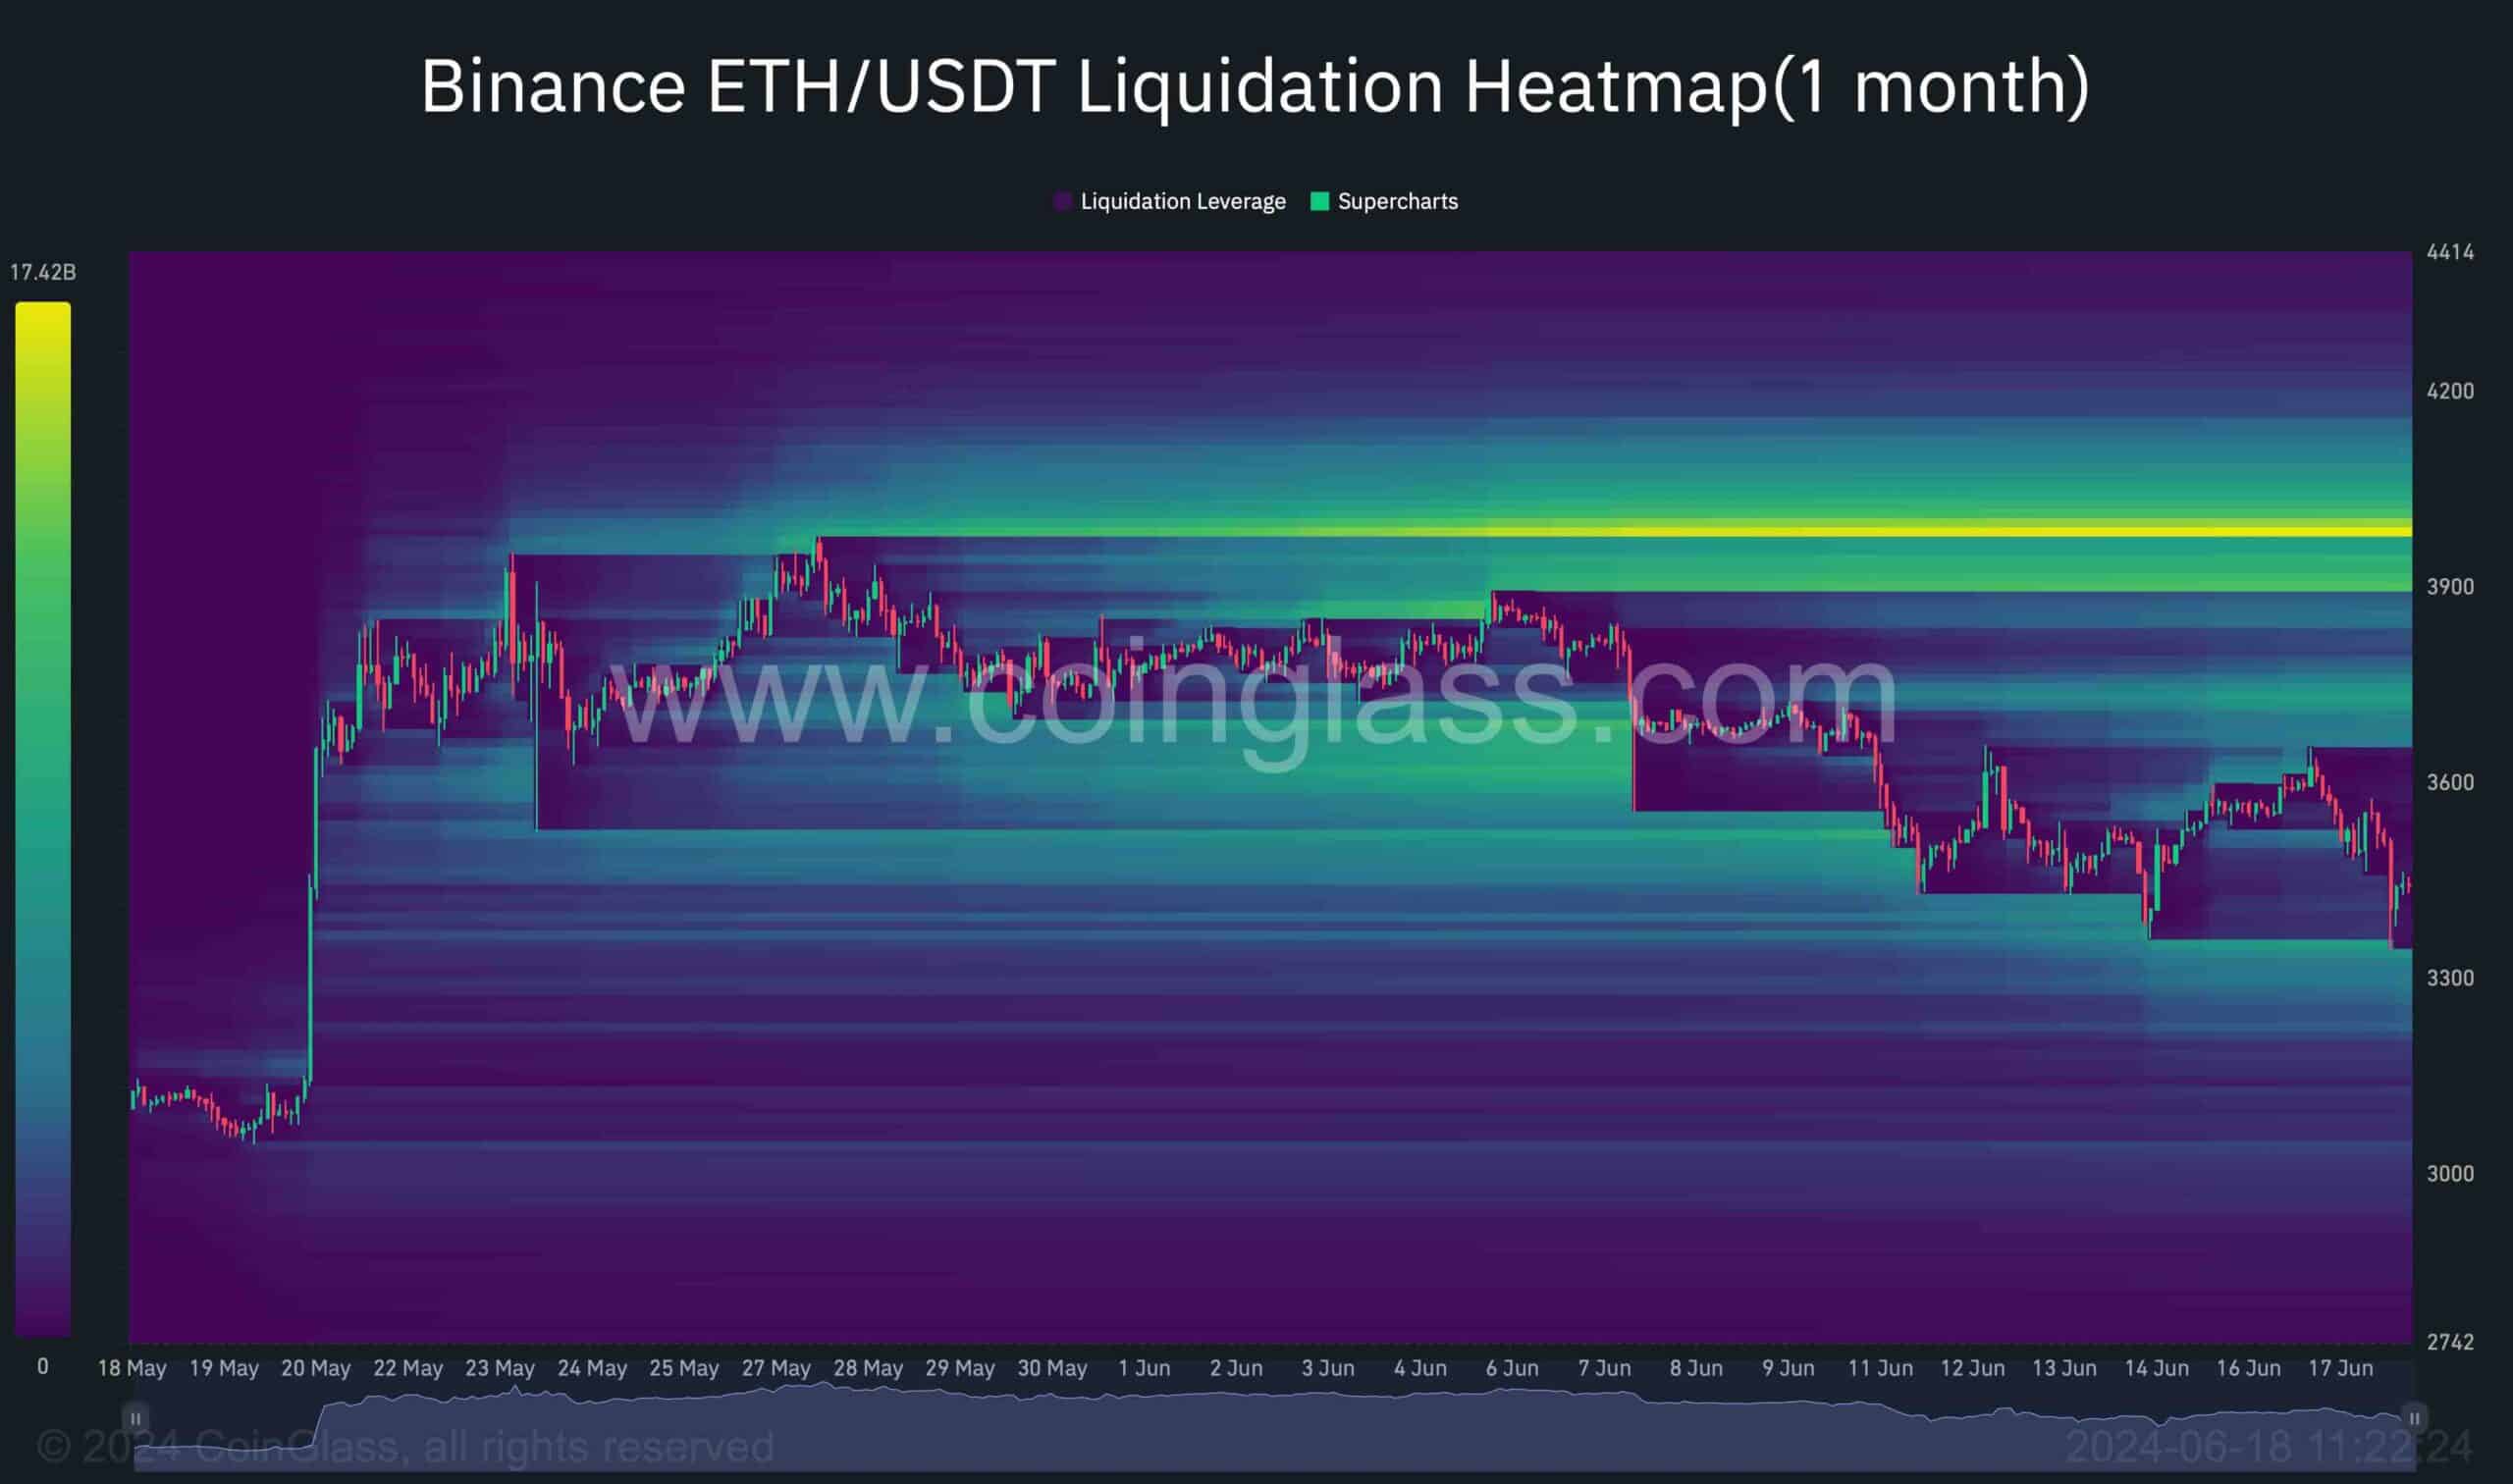
Ethereum’s price has experienced heightened selling pressure near the $4K mark, leading to a significant decline. This likely stems from participants’ aggressive interest in opening short positions near this pivotal level. Analyzing the potential liquidation levels is crucial for determining the mid-term price targets.
As the chart demonstrates, a significant amount of liquidity resides above the crucial $3.9K mark, potentially representing buy-stop orders from notable short positions around this critical juncture. This liquidity region is likely to be the main target for buyers if demand returns to the market and the price experiences a bullish reversal near the $3K threshold.
Reaching this crucial liquidity range would likely lead to increased market volatility and potentially trigger a short-squeeze event, where short positions are forced to cover, driving the price higher. Nevertheless, if the selling pressure continues and Ethereum fails to reclaim higher levels, the price may continue to consolidate or decline.
The post Is ETH in Danger of Falling to $3K or Will the Bulls Wake Up? (Ethereum Price Analysis) appeared first on CryptoPotato.
Read More
Is ETH in Danger of Falling to $3K or Will the Bulls Wake Up? (Ethereum Price Analysis)
Ethereum’s price has landed on a decisive and substantial support region following a brief consolidation correction stage, with potential for a bullish reversal.
However, if Ethereum sellers breach this pivot, a cascade in the market is likely.
Technical Analysis
By Shayan
The Daily Chart
A closer look at the daily chart shows that Ethereum has reached a pivotal support region after a brief consolidation correction stage. This region encompasses the price range between the 0.5 ($3421) and 0.618 ($3289) Fibonacci levels, aligning with the substantial support of the 100-day moving average ($3412). T
The alignment of these support indicators highlights the strength of this critical level and the prevailing demand at this juncture, which could halt further downward pressure.
A battle between buyers and sellers is expected at this pivotal price range, leading to heightened market volatility and potential liquidations. The outcome will likely determine Ethereum’s upcoming trend. If sellers overcome buyers and breach this crucial support region, a cascade toward the 200-day moving average at $2996 will be imminent.
The 4-Hour Chart
On the 4-hour chart, Ethereum formed a head and shoulders pattern, resulting in increased selling activity and a break below the pattern’s neckline.
This development and a bearish divergence between the price and the RSI indicator have heightened bearish momentum, leading to a significant downward movement. Following this, Ethereum has formed a descending flag pattern, a well-known bullish continuation pattern if breached from the upper boundary.
Currently, the price is hovering around a critical and decisive support region marked by the 0.5 ($3420) to 0.618 ($3289) Fibonacci retracement levels and the flag’s lower boundary. This area is experiencing intensified volatility and fluctuations.
If sellers break down this crucial support, an impulsive downtrend targeting the $2.9K support is expected. Conversely, if sufficient demand returns and shrinks the existing supply, a reversal towards the flag’s upper boundary at $3.6K will likely occur.
Sentiment Analysis
By Shayan
Ethereum’s price has experienced heightened selling pressure near the $4K mark, leading to a significant decline. This likely stems from participants’ aggressive interest in opening short positions near this pivotal level. Analyzing the potential liquidation levels is crucial for determining the mid-term price targets.
As the chart demonstrates, a significant amount of liquidity resides above the crucial $3.9K mark, potentially representing buy-stop orders from notable short positions around this critical juncture. This liquidity region is likely to be the main target for buyers if demand returns to the market and the price experiences a bullish reversal near the $3K threshold.
Reaching this crucial liquidity range would likely lead to increased market volatility and potentially trigger a short-squeeze event, where short positions are forced to cover, driving the price higher. Nevertheless, if the selling pressure continues and Ethereum fails to reclaim higher levels, the price may continue to consolidate or decline.
The post Is ETH in Danger of Falling to $3K or Will the Bulls Wake Up? (Ethereum Price Analysis) appeared first on CryptoPotato.
Read More