
Ethereum Price Analysis: What Are ETH’s Key Levels After the Breakout?
Share:
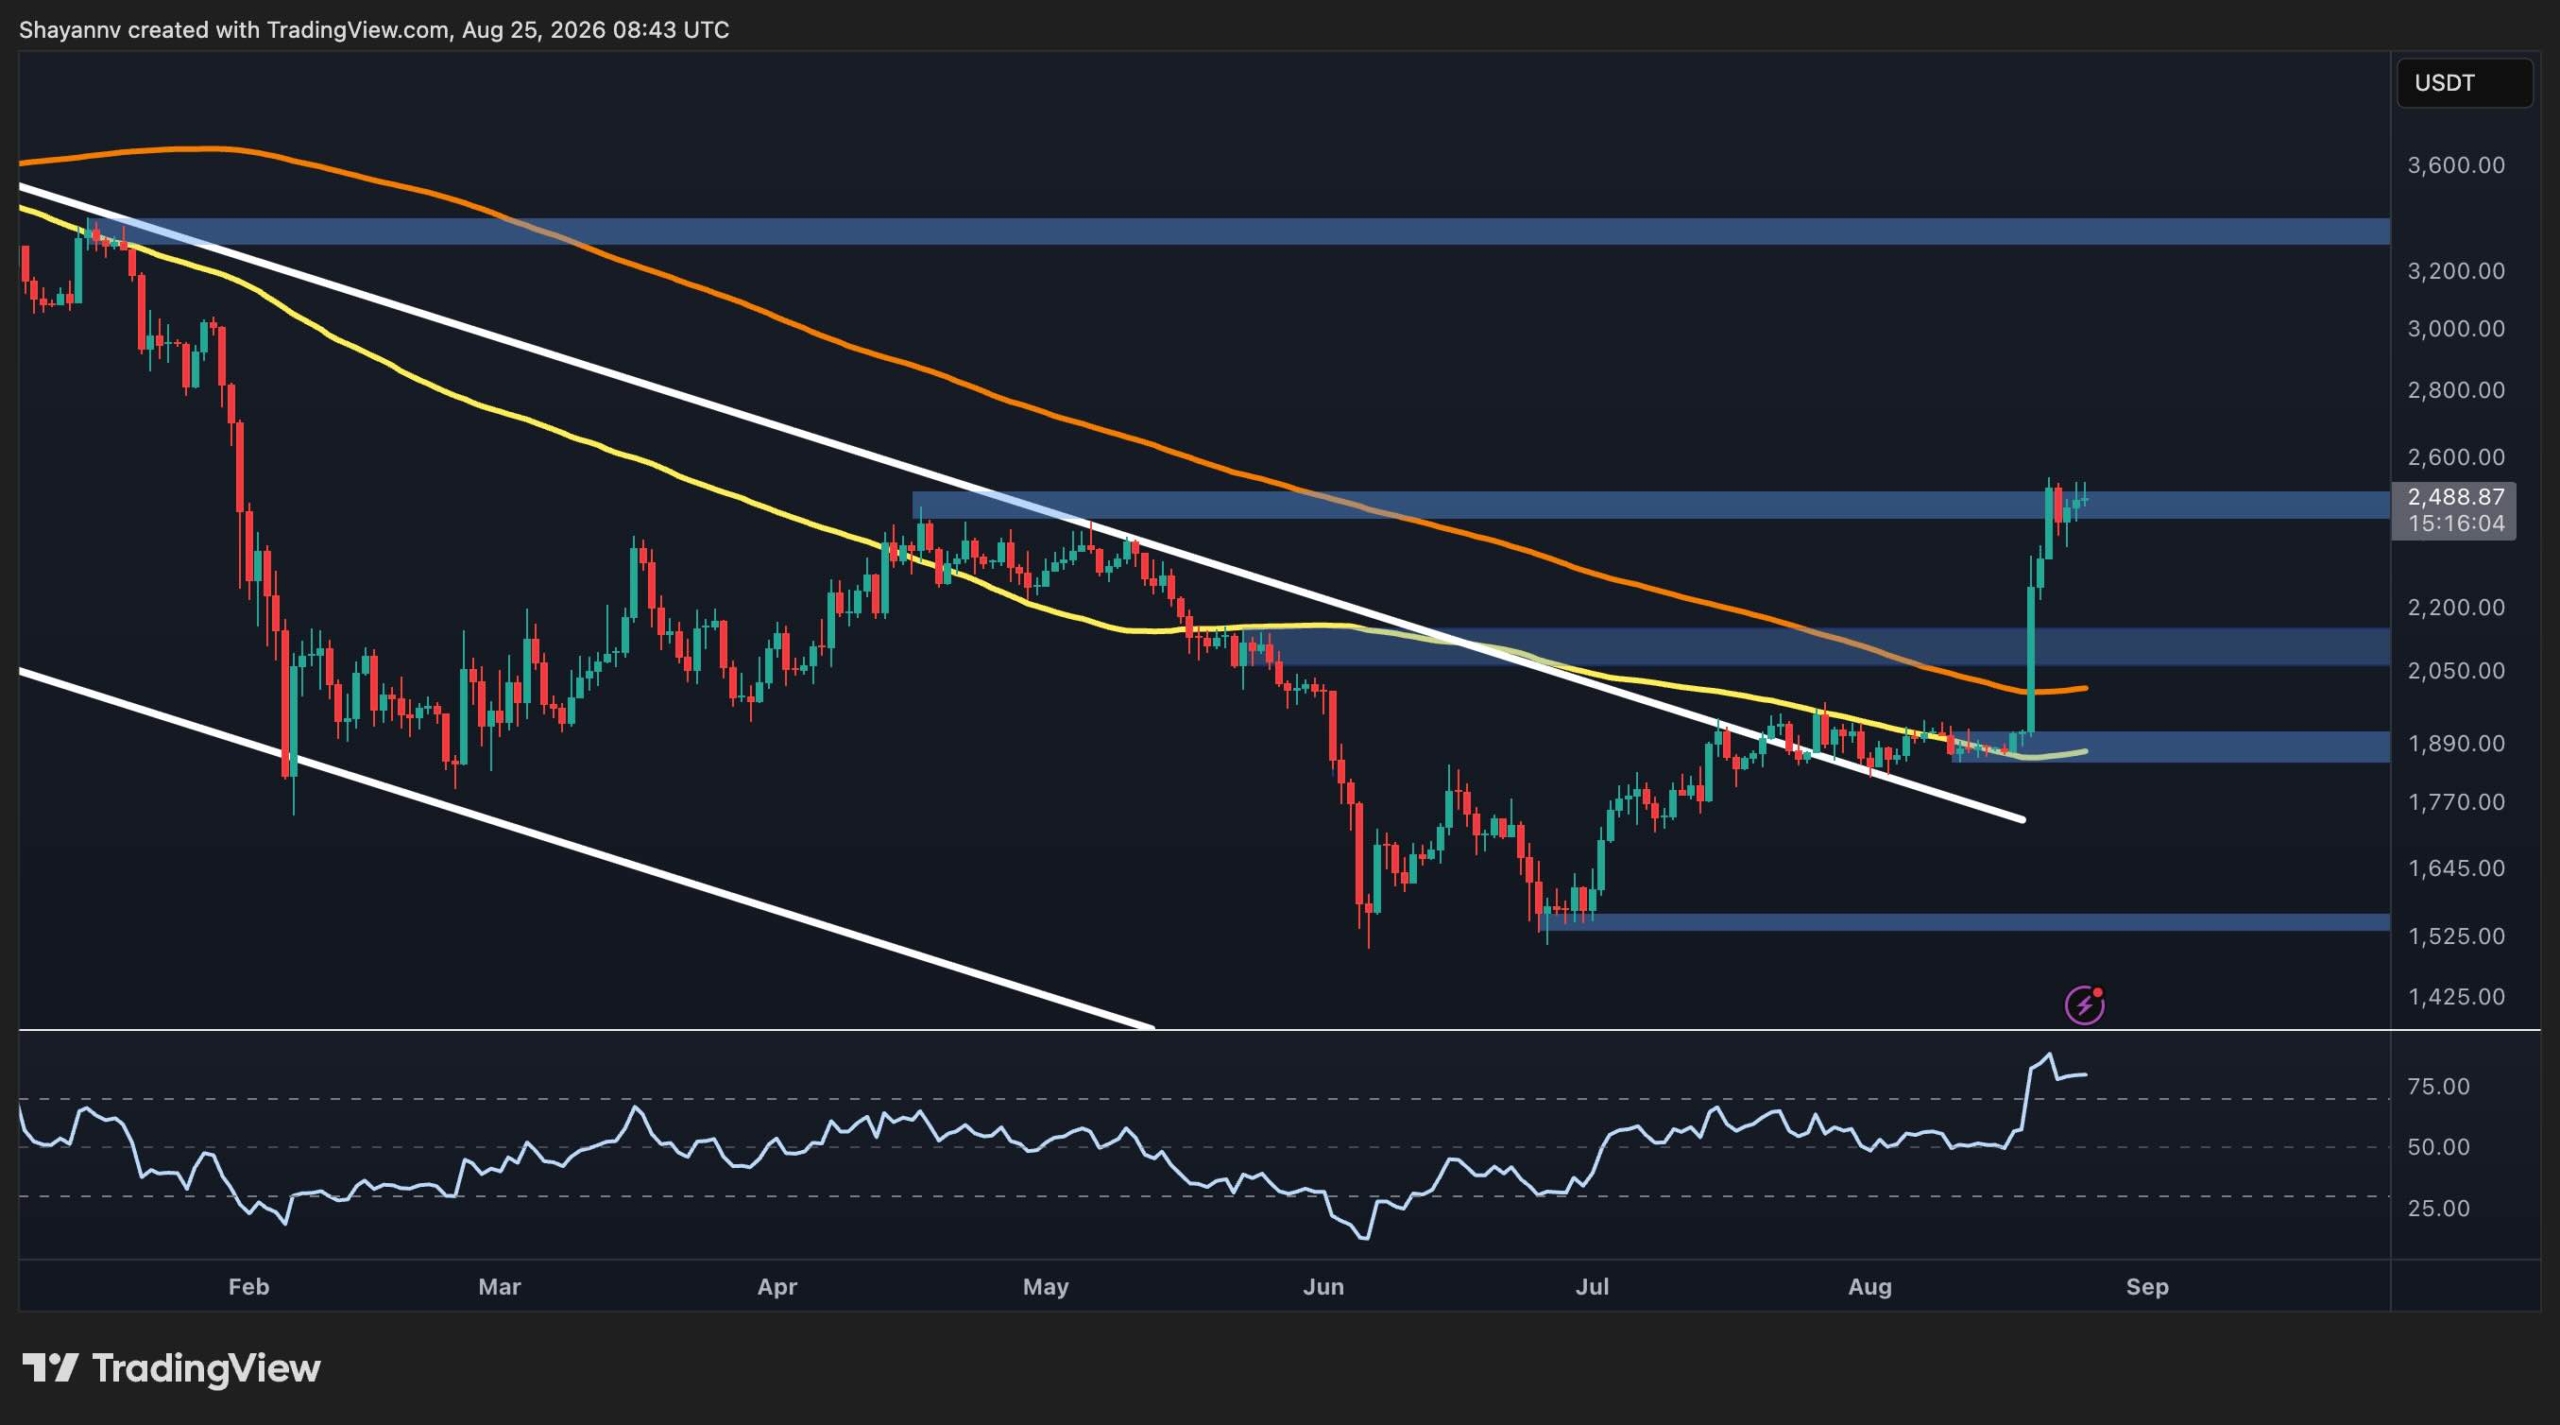
Ethereum staged a decisive breakout from a multi-week consolidation and is trading just below $2.5K after reclaiming several key resistance levels. The move cleared the descending channel, the ~$2.1K resistance zone and both the 100-day and 200-day moving averages following a summer range between $1.5K and $2K. Momentum is stretched and ETH is testing a major resistance zone, suggesting improved market structure for crypto adoption but potential near-term pullback risk.
Predictions Markets
See what traders are focused on

Ethereum has staged a decisive breakout from the multi-week consolidation structure, with ETH now trading just below $2.5K after reclaiming several important resistance levels. The move has significantly improved the higher-timeframe structure, although momentum has become stretched and ETH is currently testing a major resistance zone.
Ethereum Price Analysis: The Daily Chart
The daily chart shows a clear structural improvement. ETH spent much of the summer consolidating between roughly $1.5K and $2K while remaining inside a descending channel. The recent breakout above the upper trendline, the $2.1K resistance zone, and the 100-day and 200-day moving averages represent an important shift in market structure.
In This News
Coins

$ 2.49K
+1.56%
$ 2.49K
+1.44%Predictions Markets
See what traders are focused on
Share:
In This News
Coins
$ 2.49K
+1.56%$ 2.49K
+1.44%Predictions Markets
See what traders are focused on
Share: