


Red Alert For Polkadot (DOT): Double-Digit Drop Sparks Investor Fears

Polkadot (DOT), the self-proclaimed “King of Interoperability” and once a darling of 2021’s bull run, is currently trading around $6.42, a far cry from its November 2021 peak of nearly $60. A flicker of optimism about DOT remains despite the general bearish outlook, as technical analysis points to a potential price turnaround in the horizon.
Falling Wedge Hints At Bullish Breakout
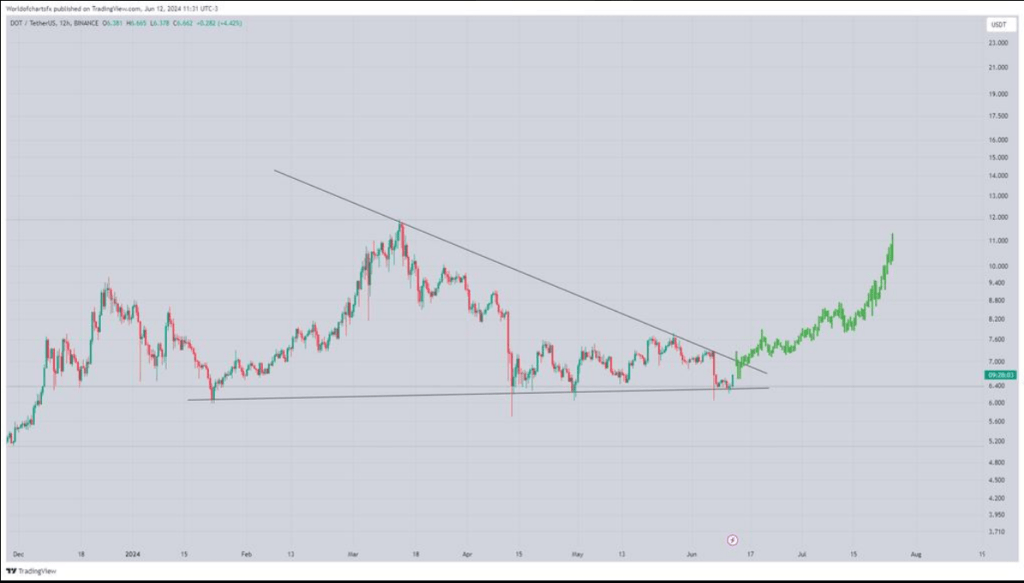
Technical analysts are a breed known for their fascination with squiggly lines and cryptic patterns. However, for some Polkadot investors, these lines might hold the key to future gains. Enter the “falling wedge,” a bullish reversal pattern identified by prominent analyst WorldOfCharts on DOT’s 12-hour timeframe.
Forming Falling Wedge Incase Of Successful Breakout Expecting Move Towards 11-12$ In Coming Days #crypto #Dot #Polkadot pic.twitter.com/VymXK89QN0
— World Of Charts (@WorldOfCharts1) June 12, 2024
This pattern, characterized by converging downward trend lines, suggests a weakening of the downward momentum, potentially leading to a price surge upwards. The point of convergence for these lines acts as a critical juncture, where a successful breakout could propel DOT’s price towards the much-desired $11-12 range.
DOT Price At A Glance
Polkadot (DOT) currently holds the 14th rank in the cryptocurrency market. With a circulating supply of approximately $10.87 billion DOT and a market cap of 1.44 billion DOT, its value has increased by $0.06 in the past 24 hours.
Over the last 7 days, DOT has risen by 16%, reflecting strong upward momentum and potential for investment. In the past month, DOT has seen a 1.83% increase, adding $0.14 to its value, indicating a promising outlook for potential future growth as a stable asset in the cryptocurrency market.
Another analyst throws their hat into the bullish ring, identifying a potential trade opportunity for DOT. LongtermX, who is known for their Fibonacci-focused predictions, highlights a possible 44% upswing for DOT, targeting the 0.618 Fibonacci retracement level at roughly $9.50.
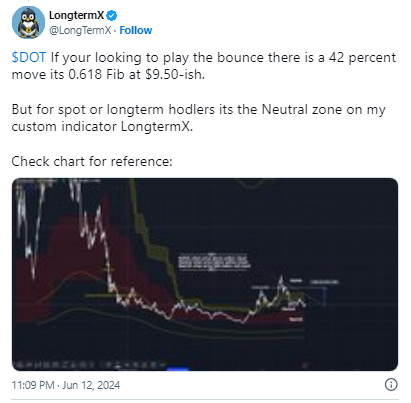
This level represents a significant resistance point, but if DOT can break free from its current price range, it could signal a significant shift in momentum.
Beyond The ChartsIt’s important to remember that Polkadot’s potential extends beyond the realm of technical indicators and price predictions. As the “King of Interoperability,” Polkadot boasts a unique architecture that allows different blockchains to communicate seamlessly.
This interoperability is a game-changer in the fragmented world of blockchain technology, potentially enabling the creation of a truly interconnected Web3 ecosystem.
Meanwhile, recent developments within the Polkadot ecosystem further bolster its long-term prospects. The successful implementation of Asynchronous Backing marks a significant step towards Polkadot 2.0, a major upgrade promising increased scalability and security.
Additionally, Polkadot’s innovative community-driven sponsorship of IndyCar driver Conor Daly showcases the project’s commitment to unconventional marketing strategies.
Featured image from MAYK, chart from TradingView
Read More


Red Alert For Polkadot (DOT): Double-Digit Drop Sparks Investor Fears
Polkadot (DOT), the self-proclaimed “King of Interoperability” and once a darling of 2021’s bull run, is currently trading around $6.42, a far cry from its November 2021 peak of nearly $60. A flicker of optimism about DOT remains despite the general bearish outlook, as technical analysis points to a potential price turnaround in the horizon.
Falling Wedge Hints At Bullish Breakout
Technical analysts are a breed known for their fascination with squiggly lines and cryptic patterns. However, for some Polkadot investors, these lines might hold the key to future gains. Enter the “falling wedge,” a bullish reversal pattern identified by prominent analyst WorldOfCharts on DOT’s 12-hour timeframe.
Forming Falling Wedge Incase Of Successful Breakout Expecting Move Towards 11-12$ In Coming Days #crypto #Dot #Polkadot pic.twitter.com/VymXK89QN0
— World Of Charts (@WorldOfCharts1) June 12, 2024
This pattern, characterized by converging downward trend lines, suggests a weakening of the downward momentum, potentially leading to a price surge upwards. The point of convergence for these lines acts as a critical juncture, where a successful breakout could propel DOT’s price towards the much-desired $11-12 range.
DOT Price At A Glance
Polkadot (DOT) currently holds the 14th rank in the cryptocurrency market. With a circulating supply of approximately $10.87 billion DOT and a market cap of 1.44 billion DOT, its value has increased by $0.06 in the past 24 hours.
Over the last 7 days, DOT has risen by 16%, reflecting strong upward momentum and potential for investment. In the past month, DOT has seen a 1.83% increase, adding $0.14 to its value, indicating a promising outlook for potential future growth as a stable asset in the cryptocurrency market.
Another analyst throws their hat into the bullish ring, identifying a potential trade opportunity for DOT. LongtermX, who is known for their Fibonacci-focused predictions, highlights a possible 44% upswing for DOT, targeting the 0.618 Fibonacci retracement level at roughly $9.50.
This level represents a significant resistance point, but if DOT can break free from its current price range, it could signal a significant shift in momentum.
Beyond The ChartsIt’s important to remember that Polkadot’s potential extends beyond the realm of technical indicators and price predictions. As the “King of Interoperability,” Polkadot boasts a unique architecture that allows different blockchains to communicate seamlessly.
This interoperability is a game-changer in the fragmented world of blockchain technology, potentially enabling the creation of a truly interconnected Web3 ecosystem.
Meanwhile, recent developments within the Polkadot ecosystem further bolster its long-term prospects. The successful implementation of Asynchronous Backing marks a significant step towards Polkadot 2.0, a major upgrade promising increased scalability and security.
Additionally, Polkadot’s innovative community-driven sponsorship of IndyCar driver Conor Daly showcases the project’s commitment to unconventional marketing strategies.
Featured image from MAYK, chart from TradingView
Read More