Top 100 Coins
Trending Cryptos
Performance
Recently Listed
Gainers
All Categories
All Time High
Blockchains
Global Market Data
Ecosystems
Research
Rewards
Heatmaps
Drop Hunting
Alerts
Converter
Widgets
Market Data API
Futures and Options
Affiliate Program
PEPE Shows Signs of Breakout of the Falling Wedge, Will It Spike?
Share:

- Analyst KALEO expects PEPE to experience another spike after the formation of a descending triangle pattern.
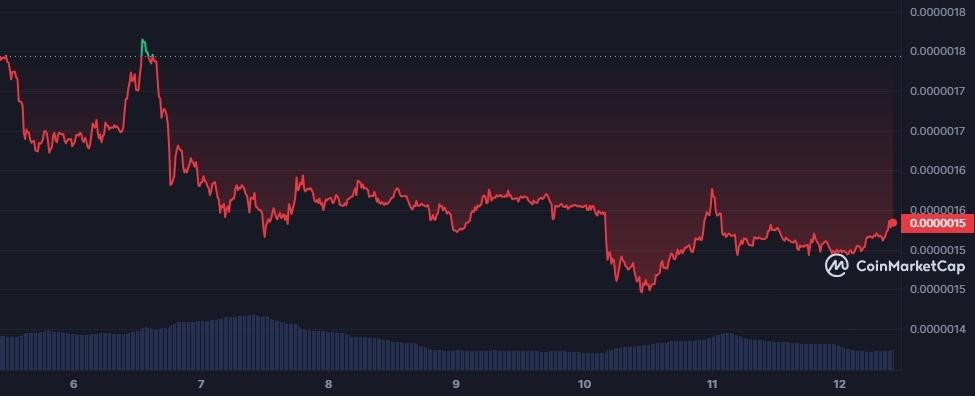
- PEPE faced a fall of 11.95% in seven days and is trading at $0.000001532.
- The meme coin’s current falling wedge pattern could drive PEPE’s price upwards.
A crypto analyst under the pseudonym KALEO made a prediction for PEPE, expecting the meme coin to experience another bull run. The crypto analyst shared a 1-hour chart of PEPE where two descending triangles had formed. When the first descending triangle pattern formed, PEPE rose drastically forming new higher highs. KALEO could be indicating that a similar sentiment could be observed soon after the formation of the second descending triangle.
Currently, PEPE is trading between its intraday high of $0.000001537 and intraday low of $0.00000149. PEPE also faced a fall of 11.95% in seven days and is trading at $0.000001532, at the reported time. According to CoinMarketCap, PEPE’s market cap is currently valued at $600,113,020 after experiencing a surge of 1.02% in one day. Moreover, PEPE’s seven-day fall led the meme coin to reside within the red zone vicinity.
The post PEPE Shows Signs of Breakout of the Falling Wedge, Will It Spike? appeared first on Coin Edition.


Read More

XRP price prediction: Will $40mln in liquidations spark a rebound?

Solana (SOL) Founder Anatoly Yakovenko Harshly Criticizes Rival Altcoin Founder! “To Avoid Disappearance….”
PEPE Shows Signs of Breakout of the Falling Wedge, Will It Spike?
Share:
- Analyst KALEO expects PEPE to experience another spike after the formation of a descending triangle pattern.
- PEPE faced a fall of 11.95% in seven days and is trading at $0.000001532.
- The meme coin’s current falling wedge pattern could drive PEPE’s price upwards.
A crypto analyst under the pseudonym KALEO made a prediction for PEPE, expecting the meme coin to experience another bull run. The crypto analyst shared a 1-hour chart of PEPE where two descending triangles had formed. When the first descending triangle pattern formed, PEPE rose drastically forming new higher highs. KALEO could be indicating that a similar sentiment could be observed soon after the formation of the second descending triangle.
Currently, PEPE is trading between its intraday high of $0.000001537 and intraday low of $0.00000149. PEPE also faced a fall of 11.95% in seven days and is trading at $0.000001532, at the reported time. According to CoinMarketCap, PEPE’s market cap is currently valued at $600,113,020 after experiencing a surge of 1.02% in one day. Moreover, PEPE’s seven-day fall led the meme coin to reside within the red zone vicinity.
The post PEPE Shows Signs of Breakout of the Falling Wedge, Will It Spike? appeared first on Coin Edition.
Read More
XRP price prediction: Will $40mln in liquidations spark a rebound?