Why Friday's Inflation Report Is A Big Deal For the Crypto Market?

The crypto market is bracing for Friday’s Personal Consumption Expenditures (PCE) inflation report, which could decide whether the Federal Reserve cuts rates in October or keeps them elevated for longer. With Bitcoin, Ethereum, and XRP all showing weakness on the daily charts, traders are watching this macroeconomic catalyst as a potential turning point.
Crypto Market: Why the Inflation Report Matters?
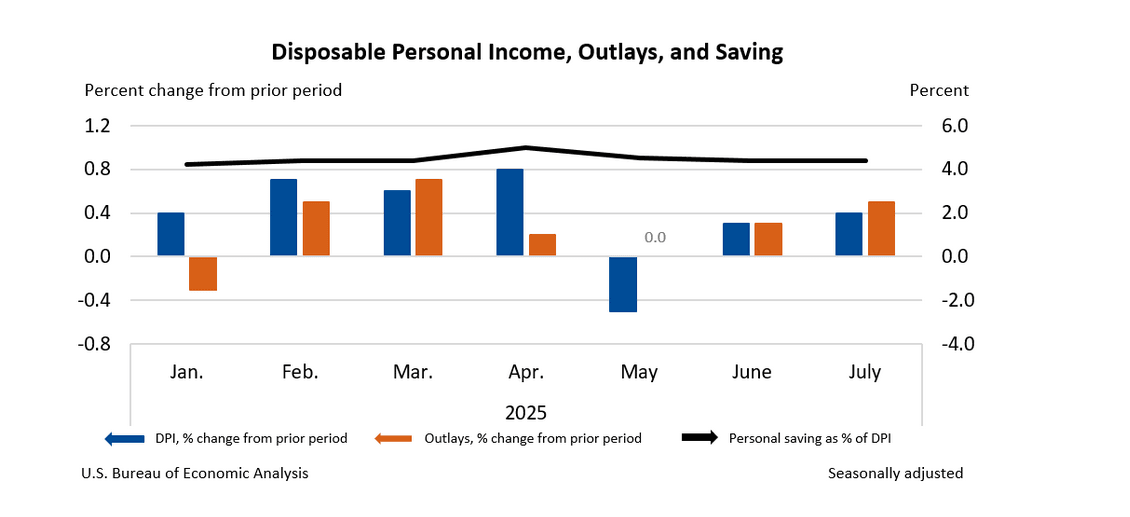
The Fed has been signaling a shift toward supporting the labor market after its first rate cut this year, but inflation remains stubbornly above the 2% target. Core PCE is expected at 2.9% year-on-year in August, unchanged from July, while headline inflation is forecasted to rise slightly from 2.6% to 2.7%. If the reading comes in hotter than expected, the Fed may pause rate cuts, reinforcing a high-rate environment that traditionally weighs on risk assets, including crypto.
For crypto traders, this means higher short-term borrowing costs, weaker liquidity, and a continued preference for yield-bearing assets like Treasuries. On the flip side, a softer inflation print could reignite the bullish narrative, with markets pricing in aggressive Fed easing by year-end.
Crypto Market: Bitcoin Daily Chart Analysis
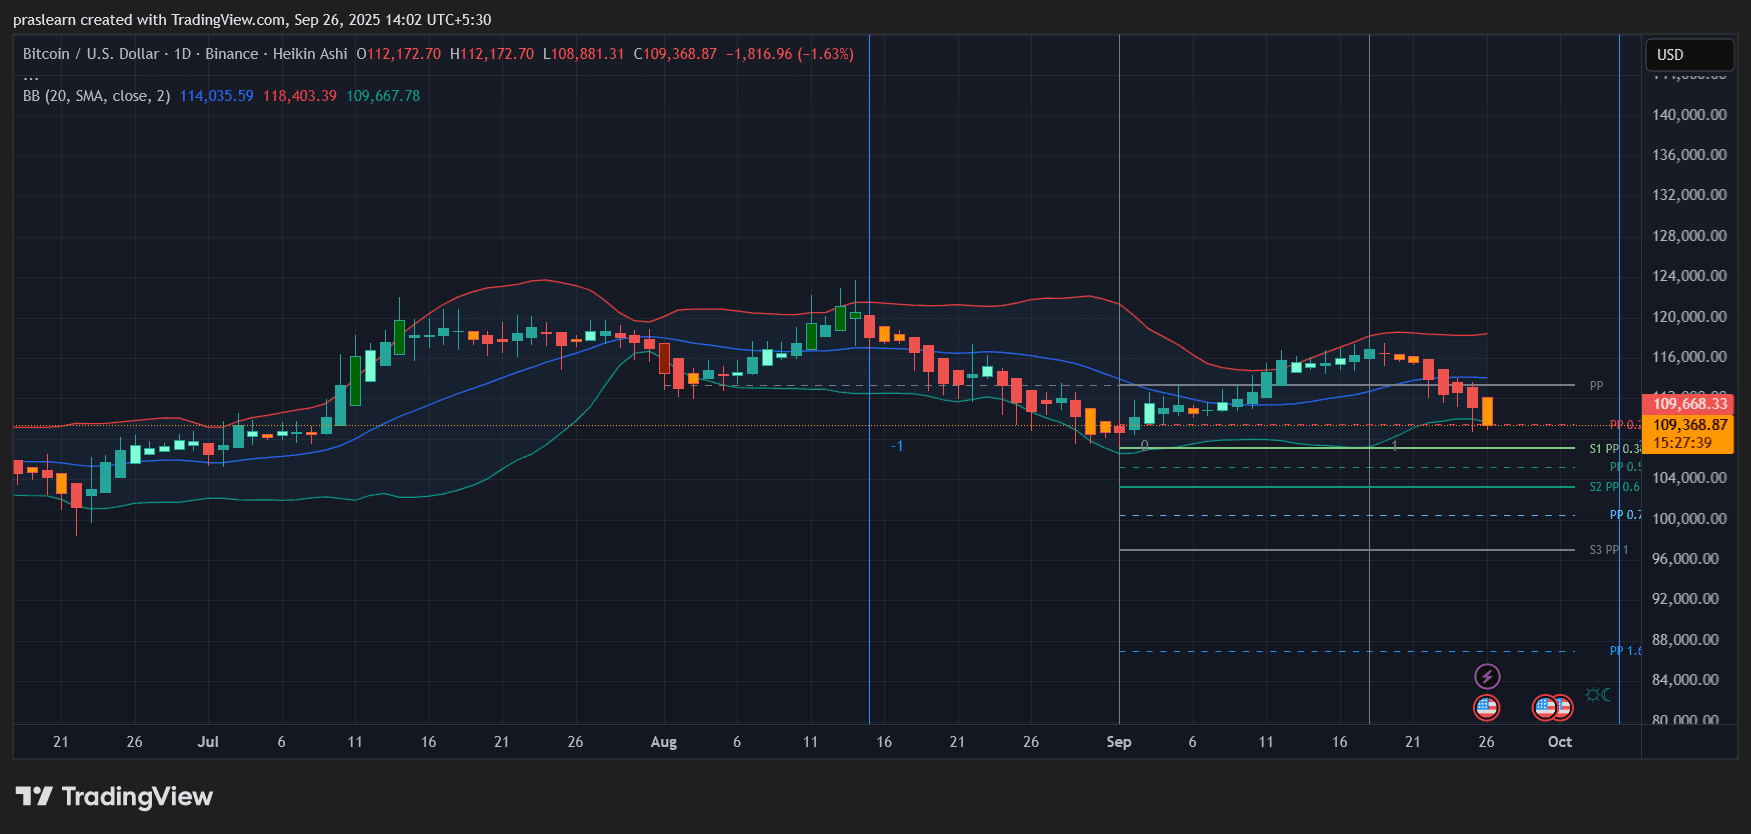
Bitcoin (BTC) has pulled back to around 109,300 after failing to hold above 112,000. The Heikin Ashi candles show consecutive red bars, reflecting consistent selling pressure. The Bollinger Bands are widening, with BTC testing the lower band near 109,600, suggesting volatility expansion to the downside.
Key levels to watch:
- Support: 107,500 (S1 pivot), followed by 104,000 (S2 pivot).
- Resistance: 112,000 short-term, then 116,000 if momentum reverses.
A hotter PCE print would likely accelerate a breakdown below 107,500, while a cooler reading could see BTC reclaim 112,000 and retest 116,000 quickly.
Crypto Market: Ethereum Daily Chart Analysis
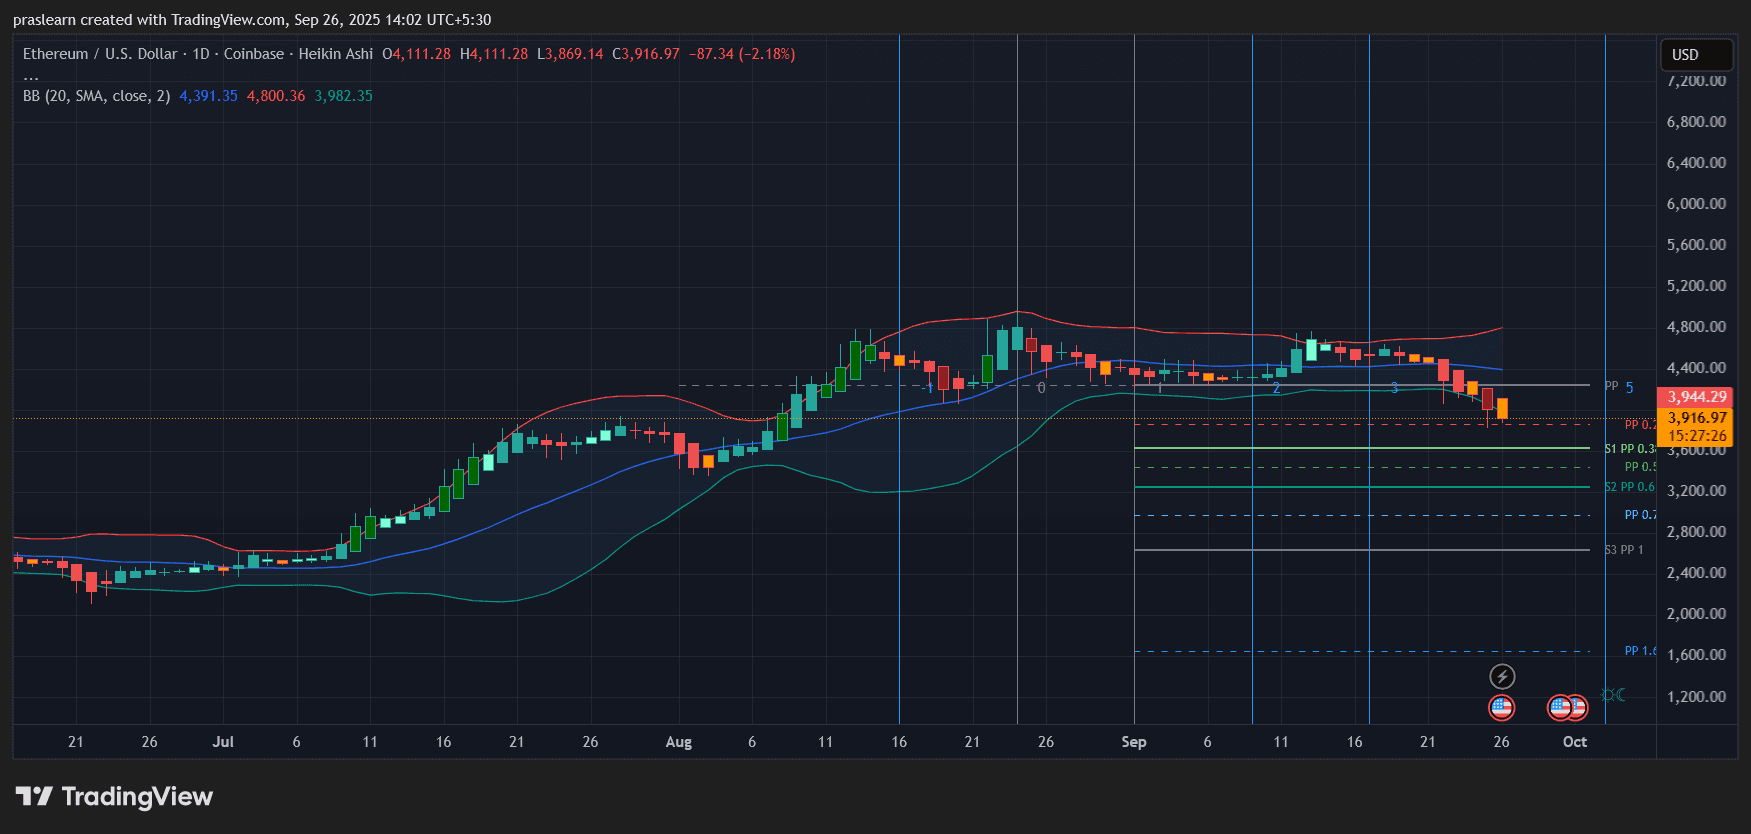
Ethereum (ETH) is trading just below 3,920, breaking below its 20-day moving average. Like BTC, ETH’s Heikin Ashi candles remain bearish, and it’s hovering just above critical support at 3,800. Bollinger Bands are starting to fan out, hinting at more volatility.
Key levels to watch:
- Support: 3,800 (psychological and technical level), followed by 3,400.
- Resistance: 4,100, then 4,400.
If inflation comes in hot, ETH risks sliding to the 3,400 zone. Conversely, a soft reading could quickly see ETH regain 4,100 and potentially push back toward 4,400 resistance.
Crypto Market: XRP Daily Chart Analysis
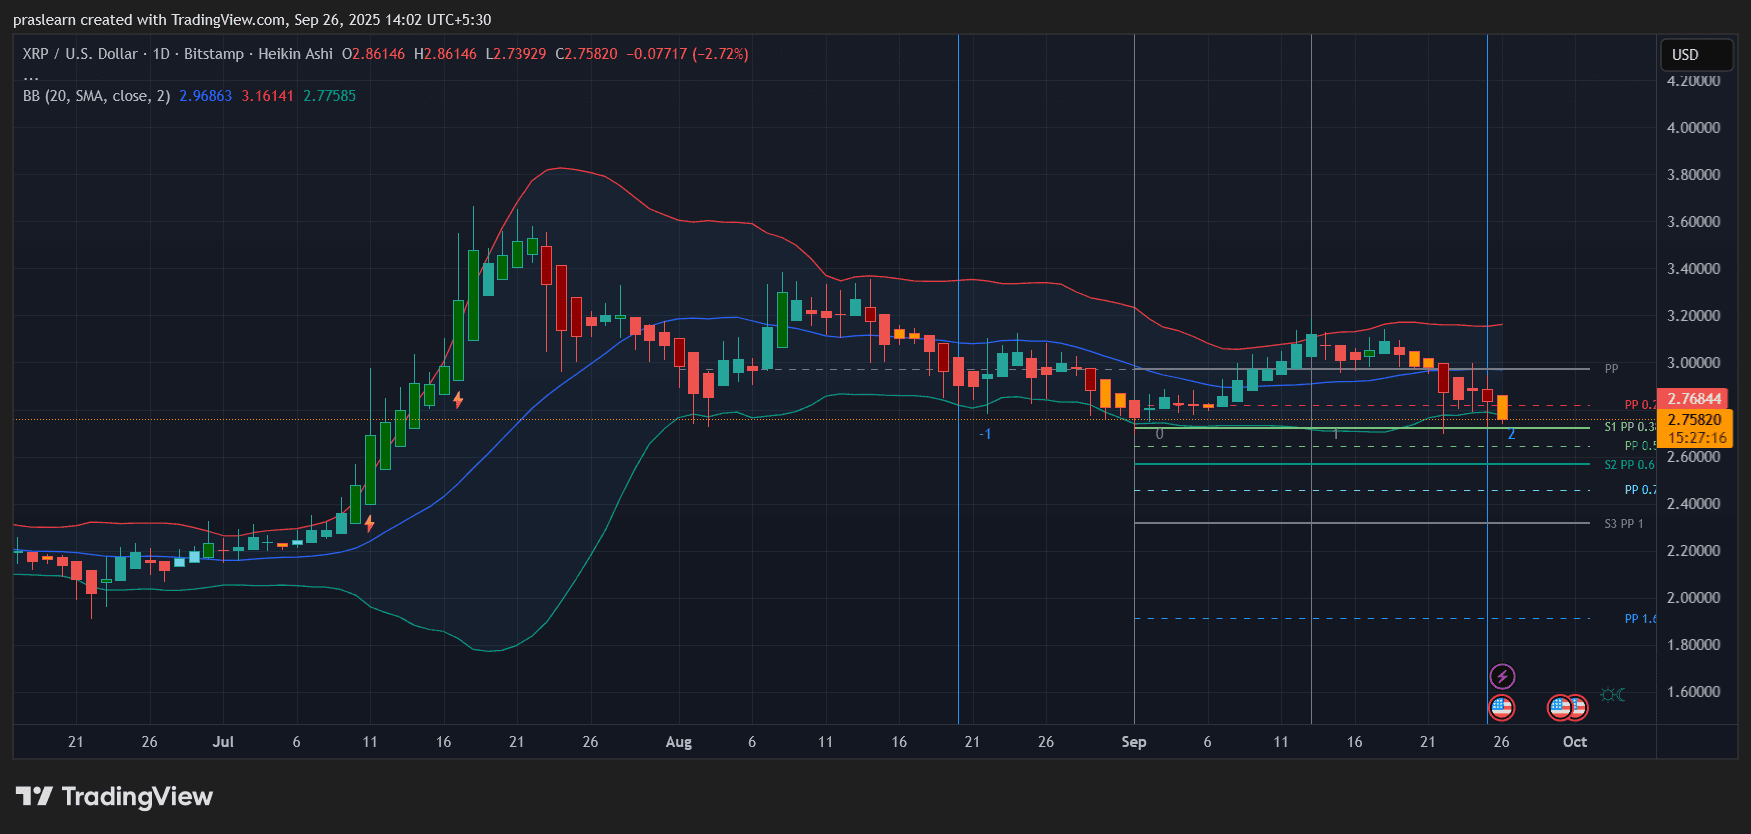
XRP is facing sharper pressure, trading around 2.75 after falling nearly 3% on the day. The structure shows a series of lower highs since mid-September, and XRP is now testing a key support zone between 2.70 and 2.60. A break below this could trigger a sharp decline toward 2.40.
Key levels to watch:
- Support: 2.70–2.60, then 2.40.
- Resistance: 2.95, then 3.10.
XRP’s vulnerability reflects its higher beta relative to BTC and ETH. Traders will likely punish XRP harder on a hawkish inflation surprise.
Total Crypto Market Cap Outlook
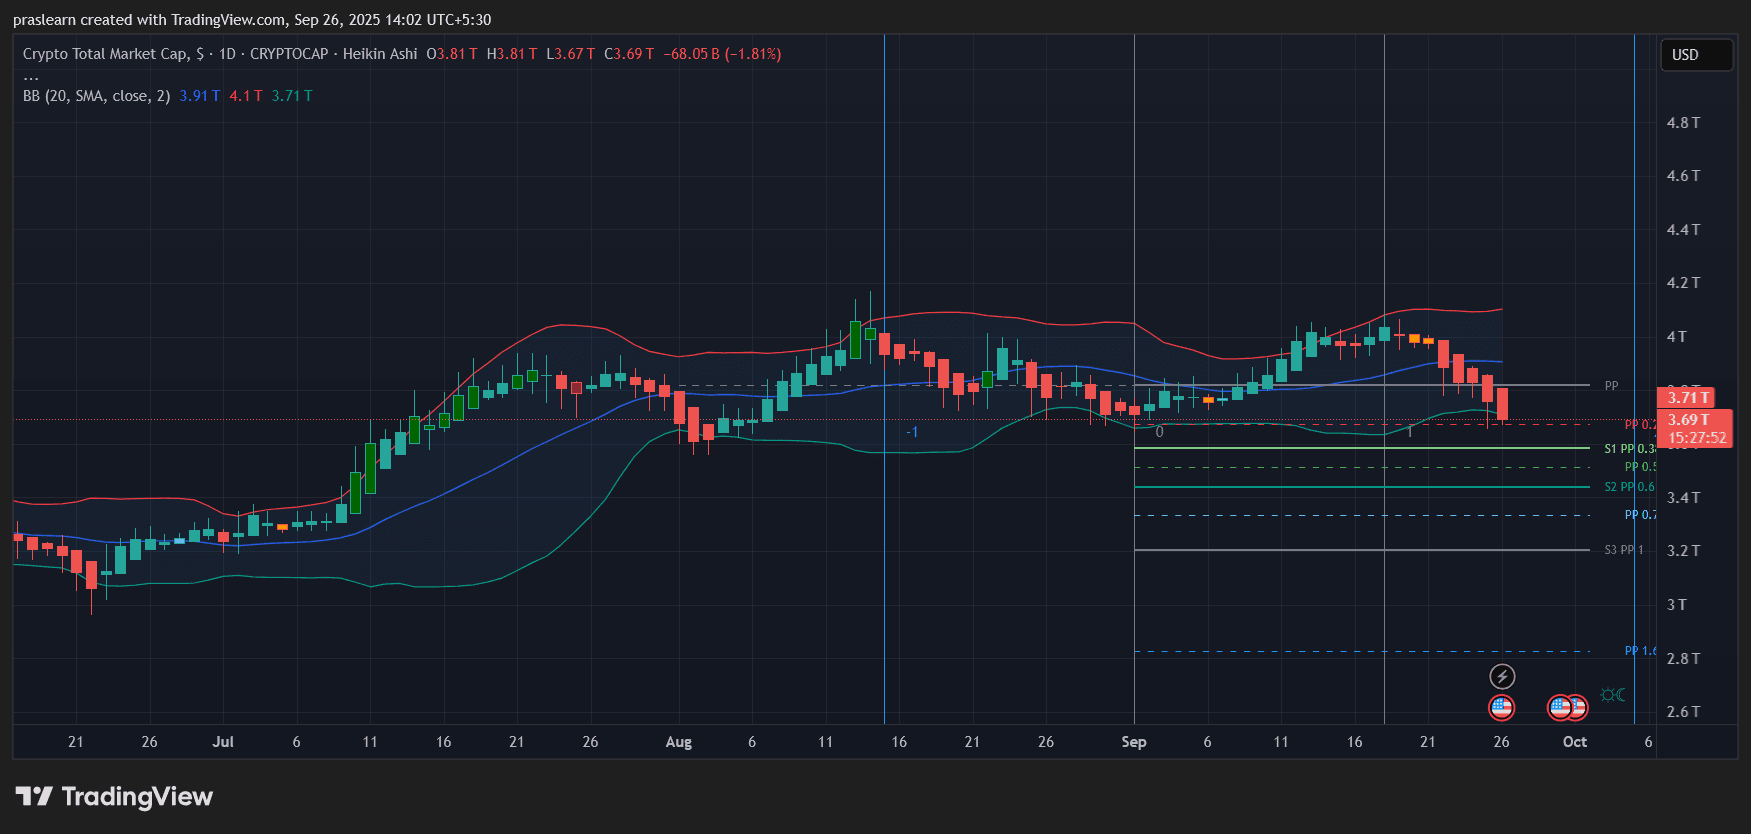
The total crypto market cap has slipped to 3.69 trillion, retreating from recent highs. The daily chart shows red Heikin Ashi candles and expansion of the lower Bollinger Band, signaling weakness across the board. Support lies at 3.60T, with deeper risk toward 3.40T if selling accelerates.
This confirms that the market is moving in unison with macro conditions rather than isolated altcoin or sector strength.
What Comes Next?
If Friday’s PCE comes in above expectations: $BTC likely breaks below 107,500, $ETH could test 3,400, and $XRP risks sliding toward 2.40. Market cap may fall below 3.60T.
If PCE is softer than forecast: BTC could bounce to 116,000, ETH may retake 4,400, and XRP has a shot at 3.10. Market cap could rebound above 3.90T.
For now, the charts lean bearish, but the PCE report will be the deciding catalyst that sets the tone for Q4.
Read More


Why Friday's Inflation Report Is A Big Deal For the Crypto Market?
The crypto market is bracing for Friday’s Personal Consumption Expenditures (PCE) inflation report, which could decide whether the Federal Reserve cuts rates in October or keeps them elevated for longer. With Bitcoin, Ethereum, and XRP all showing weakness on the daily charts, traders are watching this macroeconomic catalyst as a potential turning point.
Crypto Market: Why the Inflation Report Matters?
The Fed has been signaling a shift toward supporting the labor market after its first rate cut this year, but inflation remains stubbornly above the 2% target. Core PCE is expected at 2.9% year-on-year in August, unchanged from July, while headline inflation is forecasted to rise slightly from 2.6% to 2.7%. If the reading comes in hotter than expected, the Fed may pause rate cuts, reinforcing a high-rate environment that traditionally weighs on risk assets, including crypto.
For crypto traders, this means higher short-term borrowing costs, weaker liquidity, and a continued preference for yield-bearing assets like Treasuries. On the flip side, a softer inflation print could reignite the bullish narrative, with markets pricing in aggressive Fed easing by year-end.
Crypto Market: Bitcoin Daily Chart Analysis
Bitcoin (BTC) has pulled back to around 109,300 after failing to hold above 112,000. The Heikin Ashi candles show consecutive red bars, reflecting consistent selling pressure. The Bollinger Bands are widening, with BTC testing the lower band near 109,600, suggesting volatility expansion to the downside.
Key levels to watch:
- Support: 107,500 (S1 pivot), followed by 104,000 (S2 pivot).
- Resistance: 112,000 short-term, then 116,000 if momentum reverses.
A hotter PCE print would likely accelerate a breakdown below 107,500, while a cooler reading could see BTC reclaim 112,000 and retest 116,000 quickly.
Crypto Market: Ethereum Daily Chart Analysis
Ethereum (ETH) is trading just below 3,920, breaking below its 20-day moving average. Like BTC, ETH’s Heikin Ashi candles remain bearish, and it’s hovering just above critical support at 3,800. Bollinger Bands are starting to fan out, hinting at more volatility.
Key levels to watch:
- Support: 3,800 (psychological and technical level), followed by 3,400.
- Resistance: 4,100, then 4,400.
If inflation comes in hot, ETH risks sliding to the 3,400 zone. Conversely, a soft reading could quickly see ETH regain 4,100 and potentially push back toward 4,400 resistance.
Crypto Market: XRP Daily Chart Analysis
XRP is facing sharper pressure, trading around 2.75 after falling nearly 3% on the day. The structure shows a series of lower highs since mid-September, and XRP is now testing a key support zone between 2.70 and 2.60. A break below this could trigger a sharp decline toward 2.40.
Key levels to watch:
- Support: 2.70–2.60, then 2.40.
- Resistance: 2.95, then 3.10.
XRP’s vulnerability reflects its higher beta relative to BTC and ETH. Traders will likely punish XRP harder on a hawkish inflation surprise.
Total Crypto Market Cap Outlook
The total crypto market cap has slipped to 3.69 trillion, retreating from recent highs. The daily chart shows red Heikin Ashi candles and expansion of the lower Bollinger Band, signaling weakness across the board. Support lies at 3.60T, with deeper risk toward 3.40T if selling accelerates.
This confirms that the market is moving in unison with macro conditions rather than isolated altcoin or sector strength.
What Comes Next?
If Friday’s PCE comes in above expectations: $BTC likely breaks below 107,500, $ETH could test 3,400, and $XRP risks sliding toward 2.40. Market cap may fall below 3.60T.
If PCE is softer than forecast: BTC could bounce to 116,000, ETH may retake 4,400, and XRP has a shot at 3.10. Market cap could rebound above 3.90T.
For now, the charts lean bearish, but the PCE report will be the deciding catalyst that sets the tone for Q4.
Read More