AT&T stock price hits make-or-break point as a risky pattern forms

Share:
Technical: AT&T hit a record high of $29.45 this week (up ~150% from 2023 low); a risky double‑top with neckline at $22.95 threatens a reversal, but a sustained breakout above $29.45 would point to a move toward $35. - Fundamentals & guidance: Q4 revenue $33.5B, operating income $5.8B, free cash flow $4.2B; postpaid subs 74.2M (+1.5M), fiber adds +1M to 10.4M and >3M fiber locations; management expects low‑single‑digit service revenue growth through 2028, FCF rising from $18B to $21B by 2028, dividends $8.2B (yield 3.85%); forward P/E 12.52 vs sector 13, analyst revenue est $128B (this year) and $131B (next). - Crypto/market relevance: no direct DeFi/DEX/CEX or token impact reported, but resilient cash flow, dividend yield and improving fundamentals can influence institutional allocation including crypto exposure.
Predictions Markets
See what traders are focused on

The AT&T stock price has jumped this year and is now nearing the all-time high, continuing the uptrend that has been going on since 2023.
It jumped to a record high of $29.45 this week, up by 150% from its lowest point in 2023.
It has formed a risky chart pattern, which bulls need to overcome.
AT&T stock price has formed a risky chart pattern
The weekly timeframe chart shows that the AT&T share price has done well in the past few weeks and is now hovering at a crucial resistance level.
A closer look shows that the stock has formed a double-top pattern whose neckline is at $22.95, its lowest level in January this year.
A double-top is one of the most common bearish reversal signs in technical analysis.
On the positive side, the stock remains above all moving averages, a sign that bulls remain in control for now. It has also formed a hammer candle, which is made up of a body and a long lower shadow.
The Relative Strength Index (RSI) and the MACD indicators have continued rising in the past few months, a sign that the uptrend is gaining momentum.
Therefore, the stock’s outlook is neutral for now, with the double-top pattern sending a bearish outlook.
On the other hand, a rebound above the double-top point at $29.45 will invalidate the bearish outlook and point to more gains, potentially to the next key resistance level at $35.
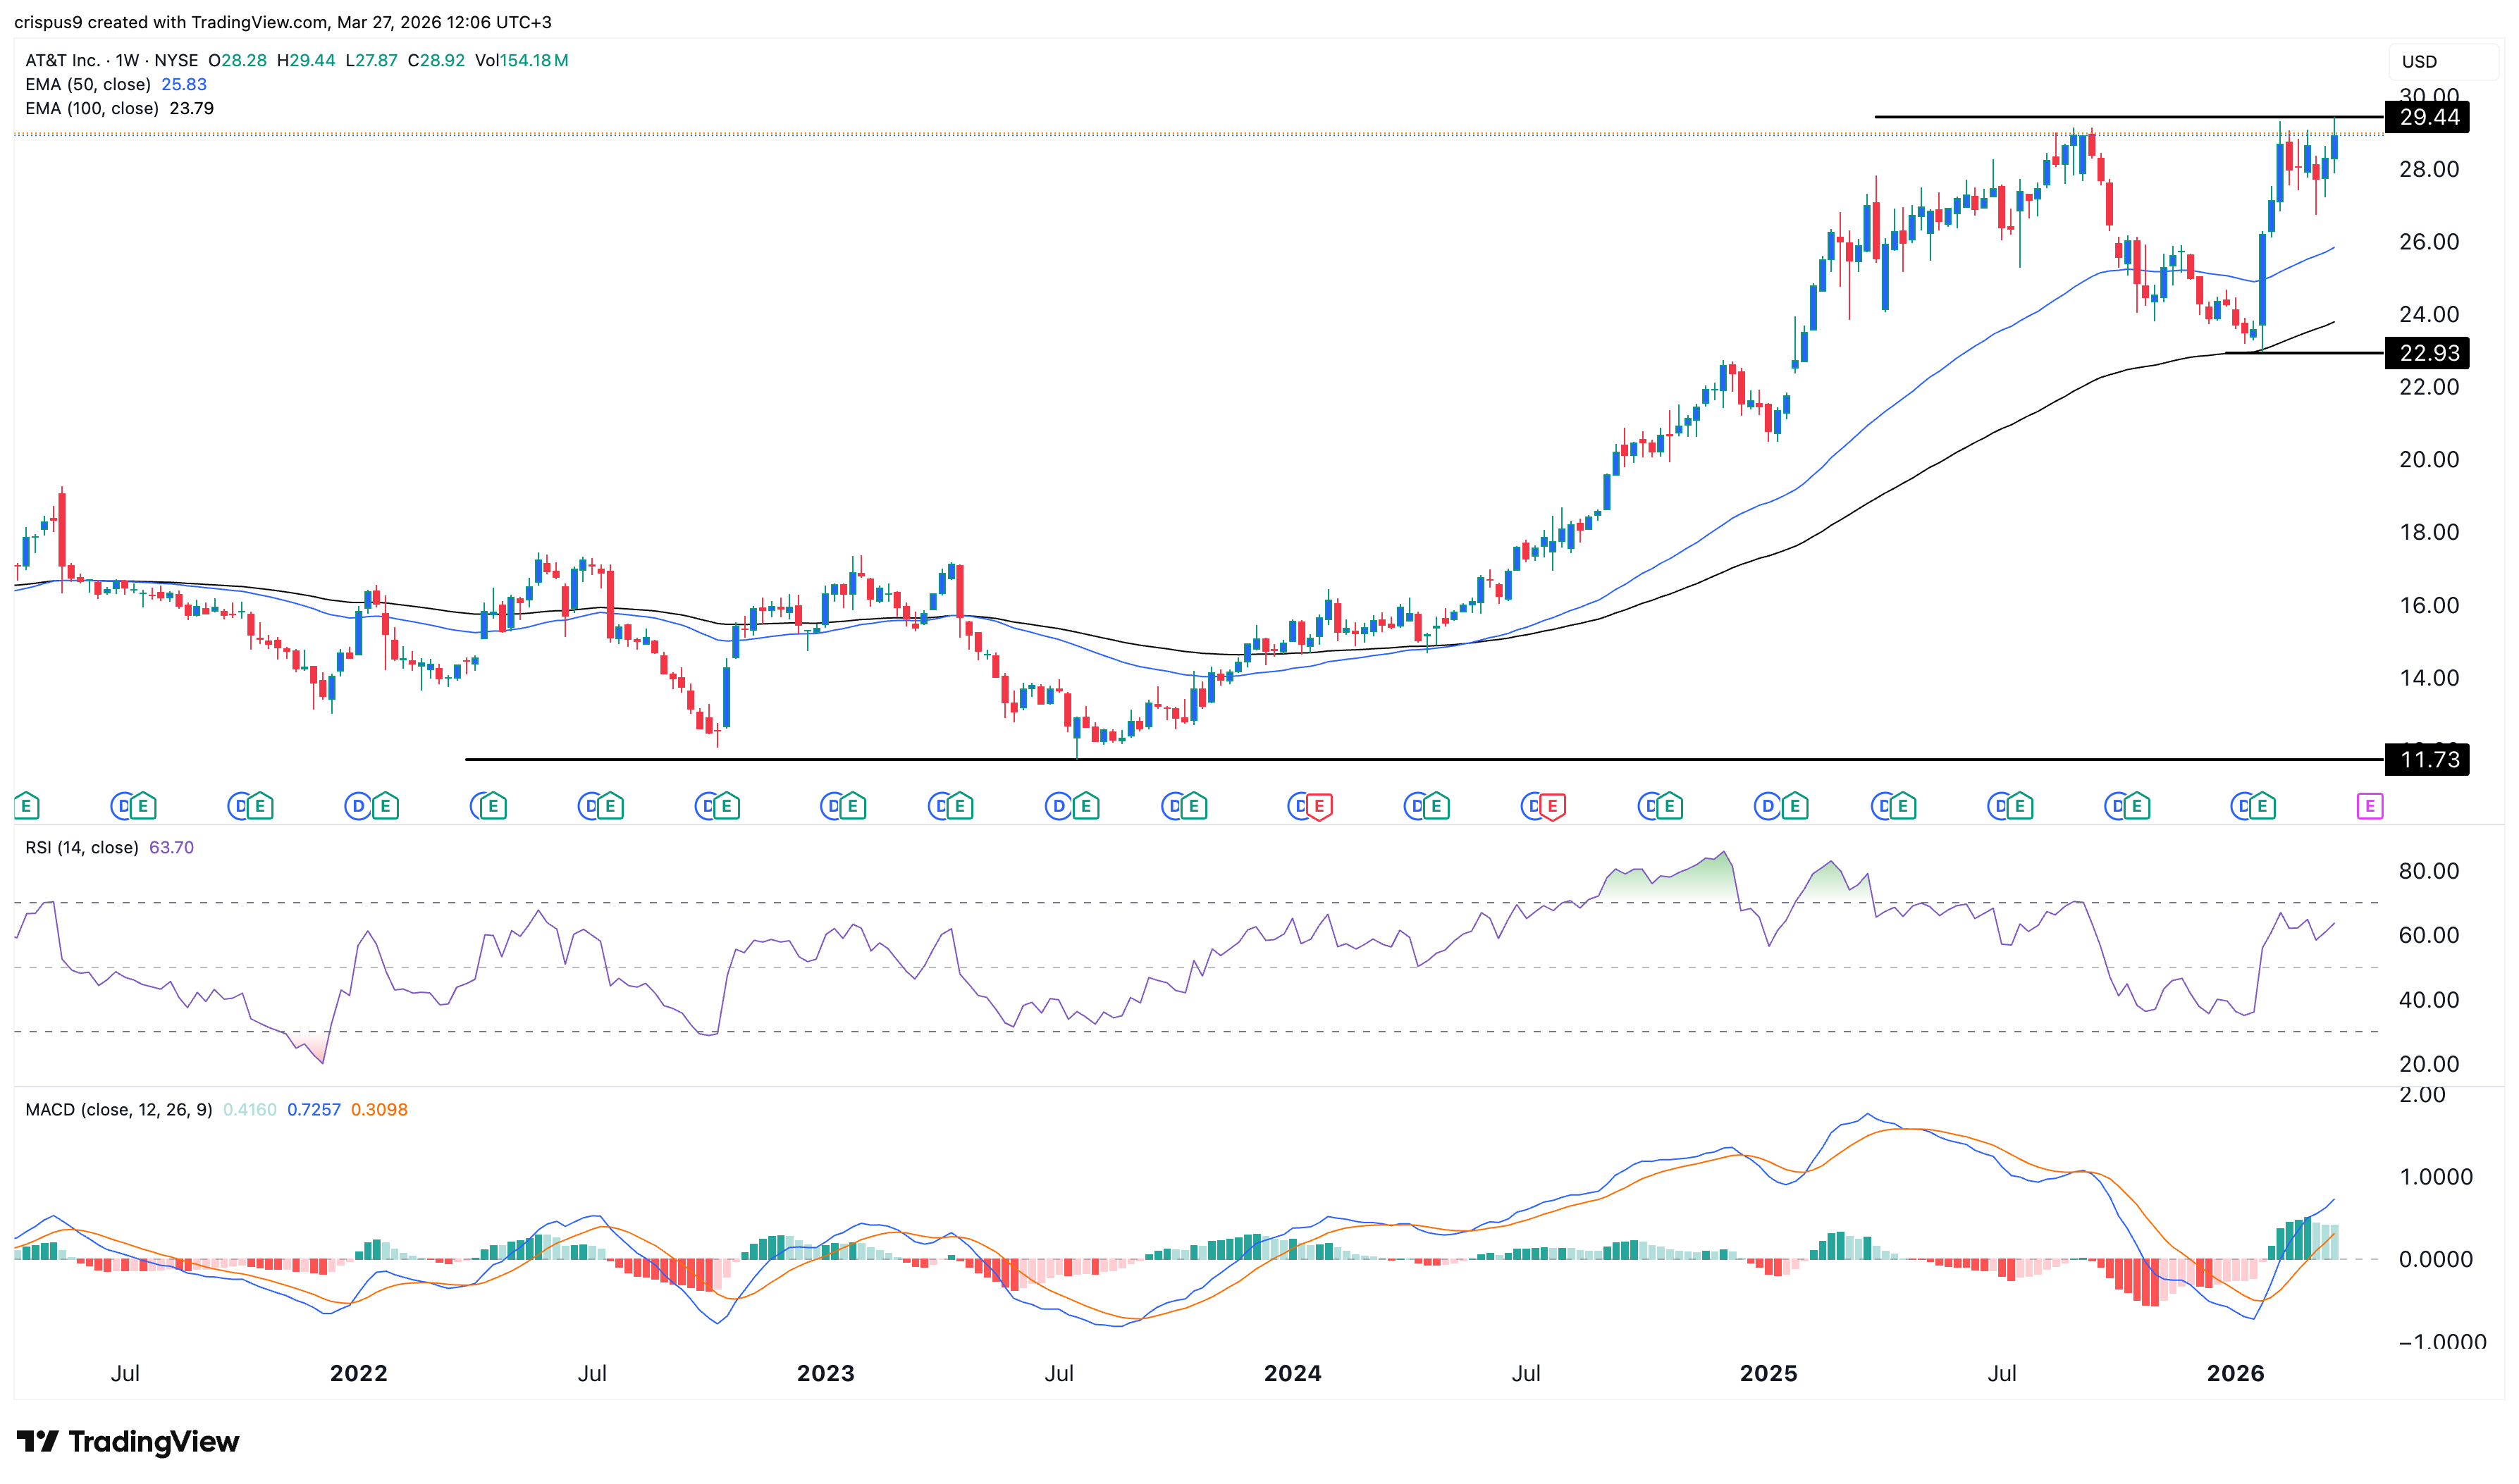
AT&T stock price chart | Source: TradingView
AT&T’s business is thriving
The most recent results showed that AT&T’s business is doing well, helped by the converged fiber and 5G business.
These numbers showed that its postpaid subscribers jumped by 1.5 million last year to 74.2 million.
Fiber additions jumped by 1 million to 10.4 million, while the number of fiber consumer and business locations rose to over 3 million.
AT&T made over $33.5 billion in the fourth quarter, with its operating income rising to $5.8 billion. Its free cash flow rose to $4.2 billion from $4.0 billion a year earlier.
The management expects that the growth will continue in the coming years. The service revenue is expected to grow in the low single digits through 2028.
Data compiled by Yahoo Finance shows that the average revenue estimate among analysts is that its annual revenue will be $128 billion this year followed by $131 billion next year.
AT&T has other bullish catalysts, including the fact that it is largely immune to the ongoing Iran war as its business will not be affected.
The management also plans to continue cutting costs and returning cash to investors. Its free cash flow is expected to jump from $18 billion this year to $21 billion in 2028.
A substantial amount of these funds will go towards dividends. It paid $8.2 billion in dividends last year, giving it a yield of 3.85%.
There are signs that AT&T stock has become a bargain, with the forward price-to-earnings ratio of 12.52, lower than the sector median of 13.
The post AT&T stock price hits make-or-break point as a risky pattern forms appeared first on Invezz
In This News
Coins

$ 0.0000568
Predictions Markets
See what traders are focused on
Share:
In This News
Coins
$ 0.0000568
Predictions Markets
See what traders are focused on
Share:
Read More

Crypto stocks MARA, COIN, Strive, MSTR rally as a bull run starts, but risks remain