Bitcoin Price Analysis: BTC Could Dump to $52K if This Support Level Is Broken
Bitcoin’s price has failed to recover above the $64K resistance level since its significant drop in the first week of August.
Yet, there are several support levels available to turn things around.
Technical Analysis
By TradingRage
The Daily Chart
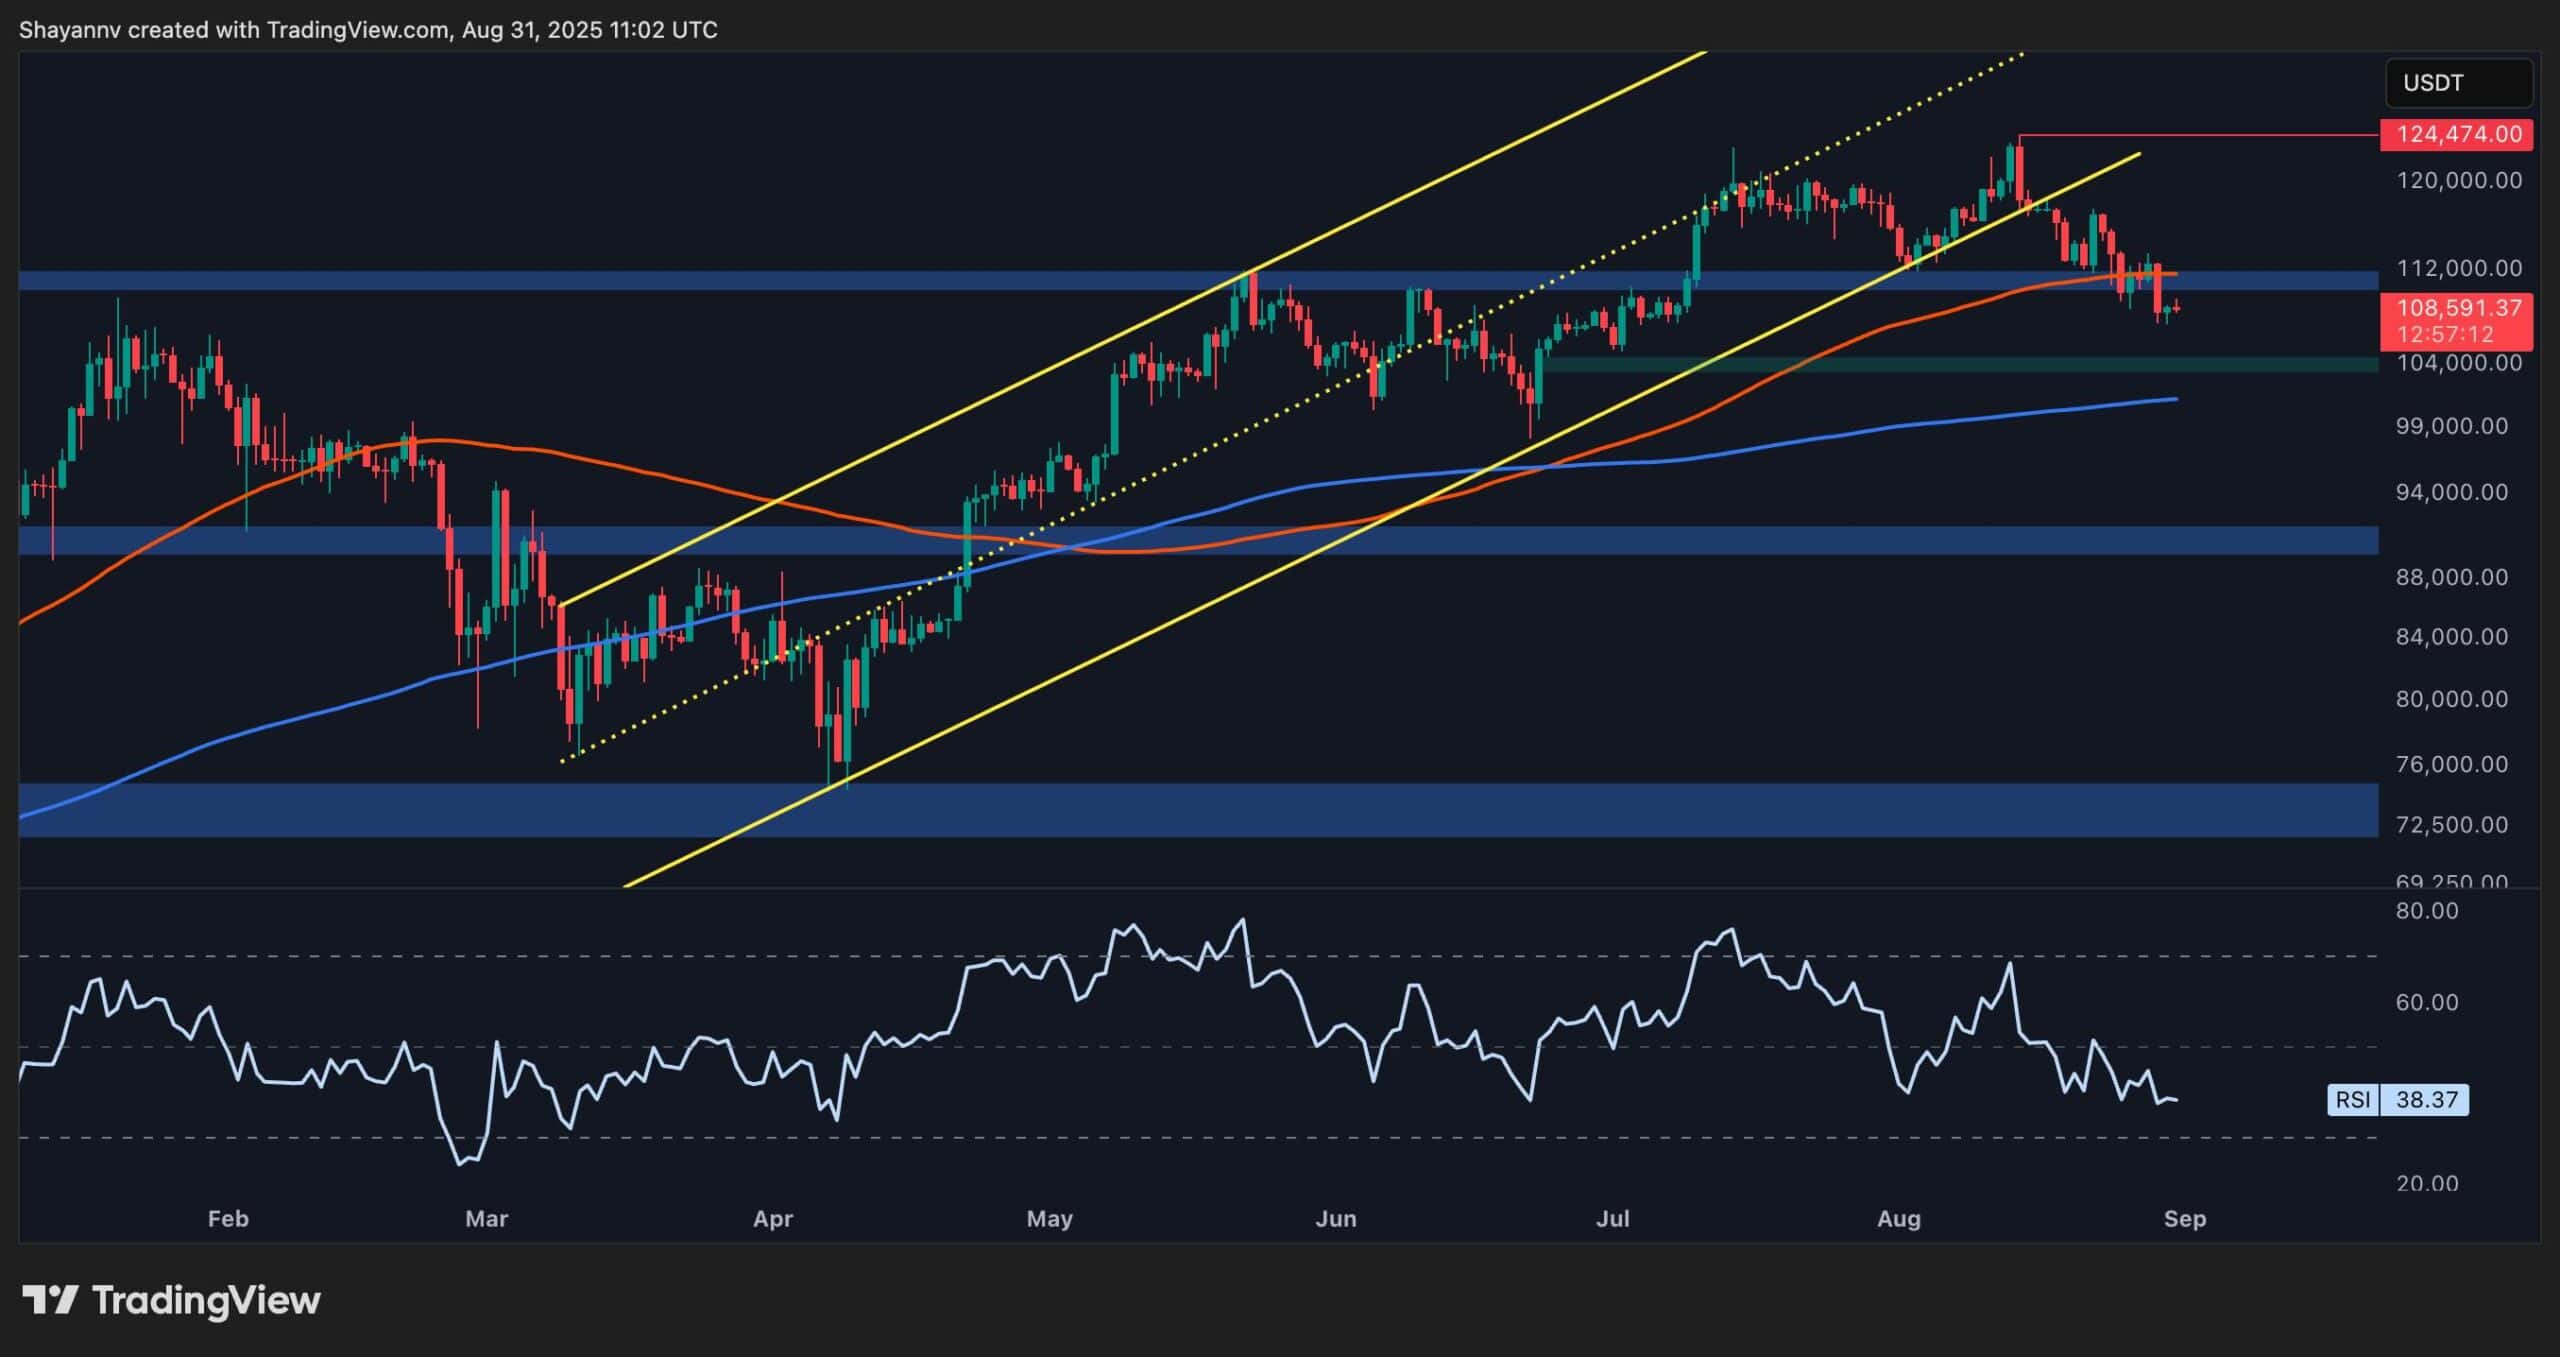
On the daily chart, the asset has been consolidating below the 200-day moving average, around the $64K mark. With the market losing the $64K and $60K levels, the cryptocurrency is close to dropping to the $56K support level. Meanwhile, this line will now act as the major support holding the entire market, preventing a more profound nosedive.
However, the market momentum is bearish, with the RSI showing values below 50%. Therefore, a breakdown of the $56K level might be probable, leading to a further drop toward $52K in the short term.
The 4-Hour Chart
Looking at the 4-hour chart, bitcoin’s price has gradually declined inside a falling wedge pattern. Yet, it has seemingly found support at the $56K support zone and is breaking the wedge to the upside. If a valid breakout occurs, the market will likely rally toward the $60K level in the coming days, with a higher probability of breaking through this time.
On-Chain Analysis
By TradingRage
Bitcoin Miner Reserve
While the price chart shows a lengthy consolidation period, bitcoin miners’ behavior can provide some hints on the future market direction.
This chart presents the bitcoin miner reserve metric, which measures the amount of BTC miners hold. As evident during the last phase of the recent bullish run, the metric has plunged significantly. This aggressive distribution by miners can be one of the primary reasons for the current correction.
Meanwhile, judging by the shape of the 7-day and 14-day exponential moving averages of miner reserve, they have seemingly eased their selling pressure, as the metric is making a U-turn to the upside. This can be good news for investors, as the excess supply by miners would decrease.
The post Bitcoin Price Analysis: BTC Could Dump to $52K if This Support Level Is Broken appeared first on CryptoPotato.
Bitcoin Price Analysis: BTC Could Dump to $52K if This Support Level Is Broken
Bitcoin’s price has failed to recover above the $64K resistance level since its significant drop in the first week of August.
Yet, there are several support levels available to turn things around.
Technical Analysis
By TradingRage
The Daily Chart
On the daily chart, the asset has been consolidating below the 200-day moving average, around the $64K mark. With the market losing the $64K and $60K levels, the cryptocurrency is close to dropping to the $56K support level. Meanwhile, this line will now act as the major support holding the entire market, preventing a more profound nosedive.
However, the market momentum is bearish, with the RSI showing values below 50%. Therefore, a breakdown of the $56K level might be probable, leading to a further drop toward $52K in the short term.
The 4-Hour Chart
Looking at the 4-hour chart, bitcoin’s price has gradually declined inside a falling wedge pattern. Yet, it has seemingly found support at the $56K support zone and is breaking the wedge to the upside. If a valid breakout occurs, the market will likely rally toward the $60K level in the coming days, with a higher probability of breaking through this time.
On-Chain Analysis
By TradingRage
Bitcoin Miner Reserve
While the price chart shows a lengthy consolidation period, bitcoin miners’ behavior can provide some hints on the future market direction.
This chart presents the bitcoin miner reserve metric, which measures the amount of BTC miners hold. As evident during the last phase of the recent bullish run, the metric has plunged significantly. This aggressive distribution by miners can be one of the primary reasons for the current correction.
Meanwhile, judging by the shape of the 7-day and 14-day exponential moving averages of miner reserve, they have seemingly eased their selling pressure, as the metric is making a U-turn to the upside. This can be good news for investors, as the excess supply by miners would decrease.
The post Bitcoin Price Analysis: BTC Could Dump to $52K if This Support Level Is Broken appeared first on CryptoPotato.


