Hyperliquid (HYPE) Drops 25% in February, Key Support Tested

Share:
Hyperliquid (HYPE) is currently priced at $29.77, down 50.07% from its all-time high of $59.39. Despite a monthly gain of 17.97%, the token has slid over 25% since February 2026 and faces potential bearish pressure with critical support levels at $23.28. Technical indicators reveal resistance at $34.21, suggesting a cautious outlook for the immediate future.
Predictions Markets
See what traders are focused on

- The token remains 50.07% down from the all-time high of $59.39 hit in September last year.
- The technical indicator shows the first resistance at $34.21, followed by second and third resistances at $37.59 and $43.09.
Hyperliquid (HYPE) has been captivating strong market attention for the past few days; however, the price action tells another story. Instead of increased interest, HYPE continuously trades on a negative side, slipping over 25% since the beginning of February 2026.
At the time of writing, the token is exchanging hands at $29.77, down by 5.51% in the past 24 hours. The seven-day move remained down by 5.92% and up around 17.97% in one month’s tenure. The token also showed an upward trajectory as compared to the last year and is up around 13.11%.
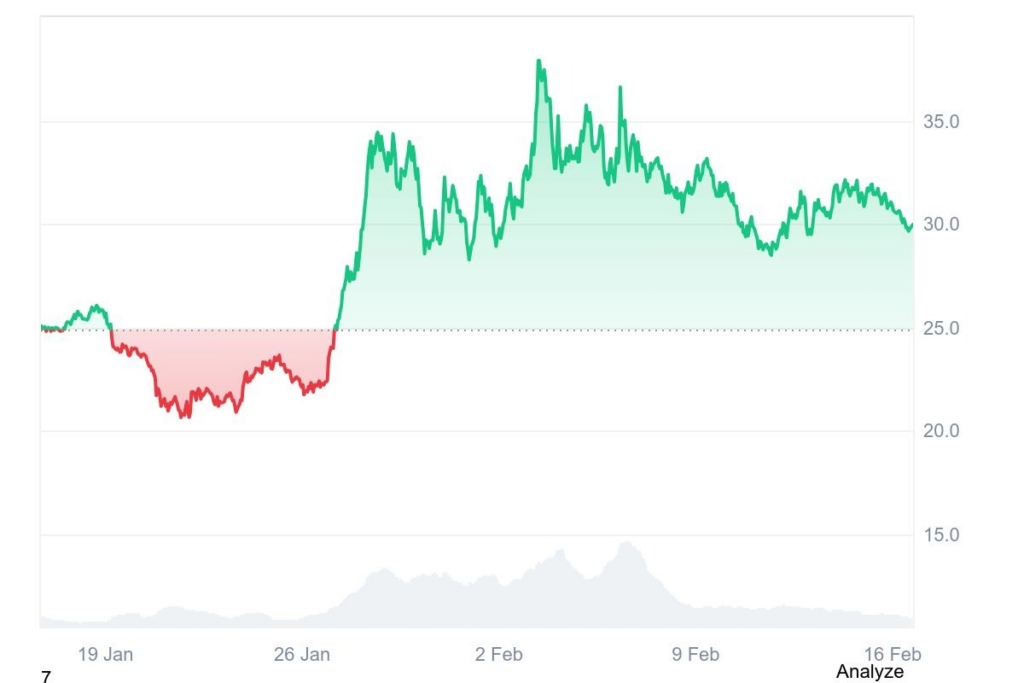
The 24-hour price performance shows a low of $29.59 and a high sitting at $31.64. The token remains 50.07% down from the all-time high of $59.39 hit in September last year and 826.7% up from the all-time low of $3.20 hit in November 2024. With this, the overall market capitalisation of the token stands at $7.76 billion.
The token seems prone to another 10% in the near future as it sits near a critical support zone. If sellers continue their control, the continuing downtrend may surge. Although, the bearish pressure could immediately fade if bulls come in with conviction.
The Technical Indicator
The technical indicator shows the first resistance at $34.21, followed by second and third resistances at $37.59 and $43.09, respectively. On the other hand, the first support level sits at $23.28, with second and third support levels at $19.92 and $14.44, respectively.
The relative strength index indicates a neutral level, being at the 50.19 mark. The 20-50-100 day exponential moving averages remain at 30.37, 29.24 and 30.71. It is noteworthy that the current fall is mostly influenced by waning bullish participation instead of aggressive selling. This also suggests that the recent move is corrective regardless of a full trend reversal.
If HYPE remains at the support zone and volume restores, a rebound is possible, possibly setting the stage for one more attempt for the resistance range.
In This News
Coins

$ 67.66
+0.17%Predictions Markets
See what traders are focused on
Share:
In This News
Coins
$ 67.66
+0.17%Predictions Markets
See what traders are focused on
Share:
Read More

Bitcoin Reclaims $64K Despite Strategy’s New Sale and Resumed US-Iran Strikes: Weekly Recap