MemeCore Flashes Strength: Can It Extend Its Bullish Streak?

Share:
MemeCore (M) jumped 20.18% and is trading around $1.50 after an early low near $1.18, breaking resistances between $1.22–$1.51 with daily trading volume of $15.94 million while the meme coin market cap sits near $26.80 billion. Chart indicators show MACD above zero and a bullish engulfing on the 4‑hour chart but a daily RSI of 70.22 signals overbought risk; immediate resistance is $1.62 with upside targets at $1.70–$1.83 and supports at $1.37 and $1.29–$1.04, outlining short-term token upside but elevated risk for traders.
Predictions Markets
See what traders are focused on

- MemeCore hovers within the $1.50 mark.
- It reports a surge in short-term bullish momentum.
With the fear sentiment floating in the market, most of the crypto assets are flashing red lights. Notably, the meme coin market cap is likely settled at $26.80 billion. Among the tokens, MemeCore (M) has posted a surge of over 20.18%, currently hovering within the $1.50 threshold.
In the early hours, the asset traded at a bottom range of around $1.18, and with the potential bull momentum, the price of MemeCore has climbed high to the $1.55 mark. It has broken a few key resistance zones between $1.22 and $1.51. In addition, its daily trading volume reached $15.94 million.
On the price chart, MemeCore shows a bull engulfing pattern, with the next crucial resistance level at $1.62. If the price momentum pushes past $1.70, a stronger trend could hit the asset’s market. Notably, the next key level would likely be near $1.83, or it may move higher.
Conversely, upon the bear’s entry into the MemeCore market, the immediate support could be within the $1.37 range. Further losses might lead the asset deeper into the downside, and it may find the former lows between $1.29 and $1.04, which act as significant zones.
Technical Chart: Will MemeCore Keep Climbing?
The four-hour trading pattern reports that the MACD line has aggressively moved above the zero line, while the signal line is lagging below the zero line. This setup indicates an explosive surge in short-term bullish momentum, and it creates a massive gap between the two lines.
MemeCore buyers have taken control and are driving the price velocity upward, and it is considered a high-momentum breakout signal. Also, it happens during the initial kickoff phase of a strong upward rally.
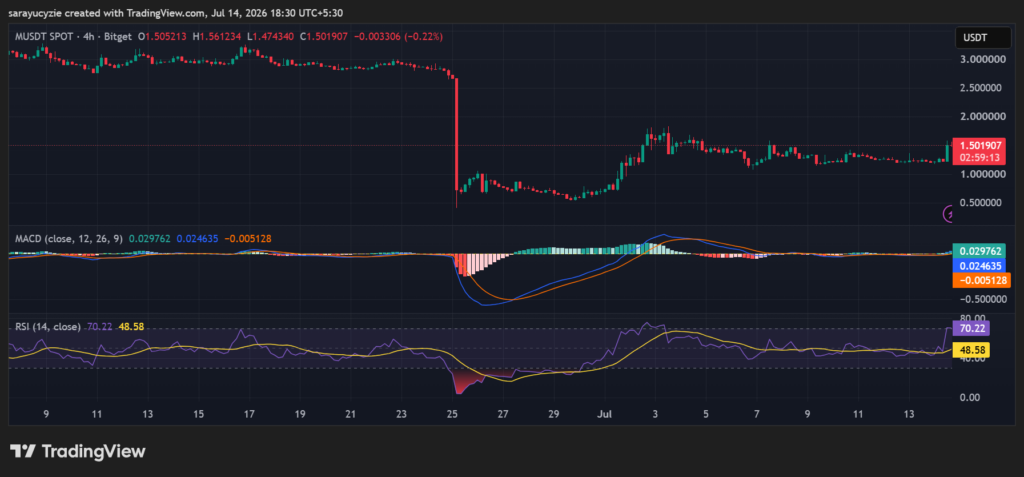
The daily RSI of 70.22 suggests its official entry into the overbought zone, with the bulls having driven a powerful, aggressive rally. However, with the current positioning, the price has extended rapidly to the upside.
This level is a caution zone, and buying here hints at entering at the tail end of a massive expansion, making it a risky entry point. Moreover, traders lock in partial profits and wait for a bearish divergence to signal a short-term reversal.
Crypto Market Highlights
MUBARAK Builds Momentum Near Key Resistance: Can Buyers Take Control?


Read More

Ethereum Price Hits Crucial Resistance Zone, Can Leverage Traders Trigger Breakout?