Ethereum Price Analysis: Is ETH Finally Attempting a Real Breakout?

Share:
Ethereum is trading above $2.2k at the start of the third week of May after a rejection near $2.4k that unwound aggressive long positioning, leaving ETH at the lower end of its two‑week range and likely to consolidate. Technically the token remains marginally supported above the 100‑day moving average (~$2.15k) and inside a mildly ascending channel whose lower boundary is rising toward $2.1k, indicating technical support but limited near‑term upside for the crypto market.
Predictions Markets
See what traders are focused on

Ethereum is trading above $2.2k as the third week of May gets underway. The asset is on the lower end of its range over the past two weeks after another rejection. The aggressive long positioning that had built up into the $2.4k resistance zone has been unwound, and the price chart indicates that more consolidation is likely to happen in the coming days.
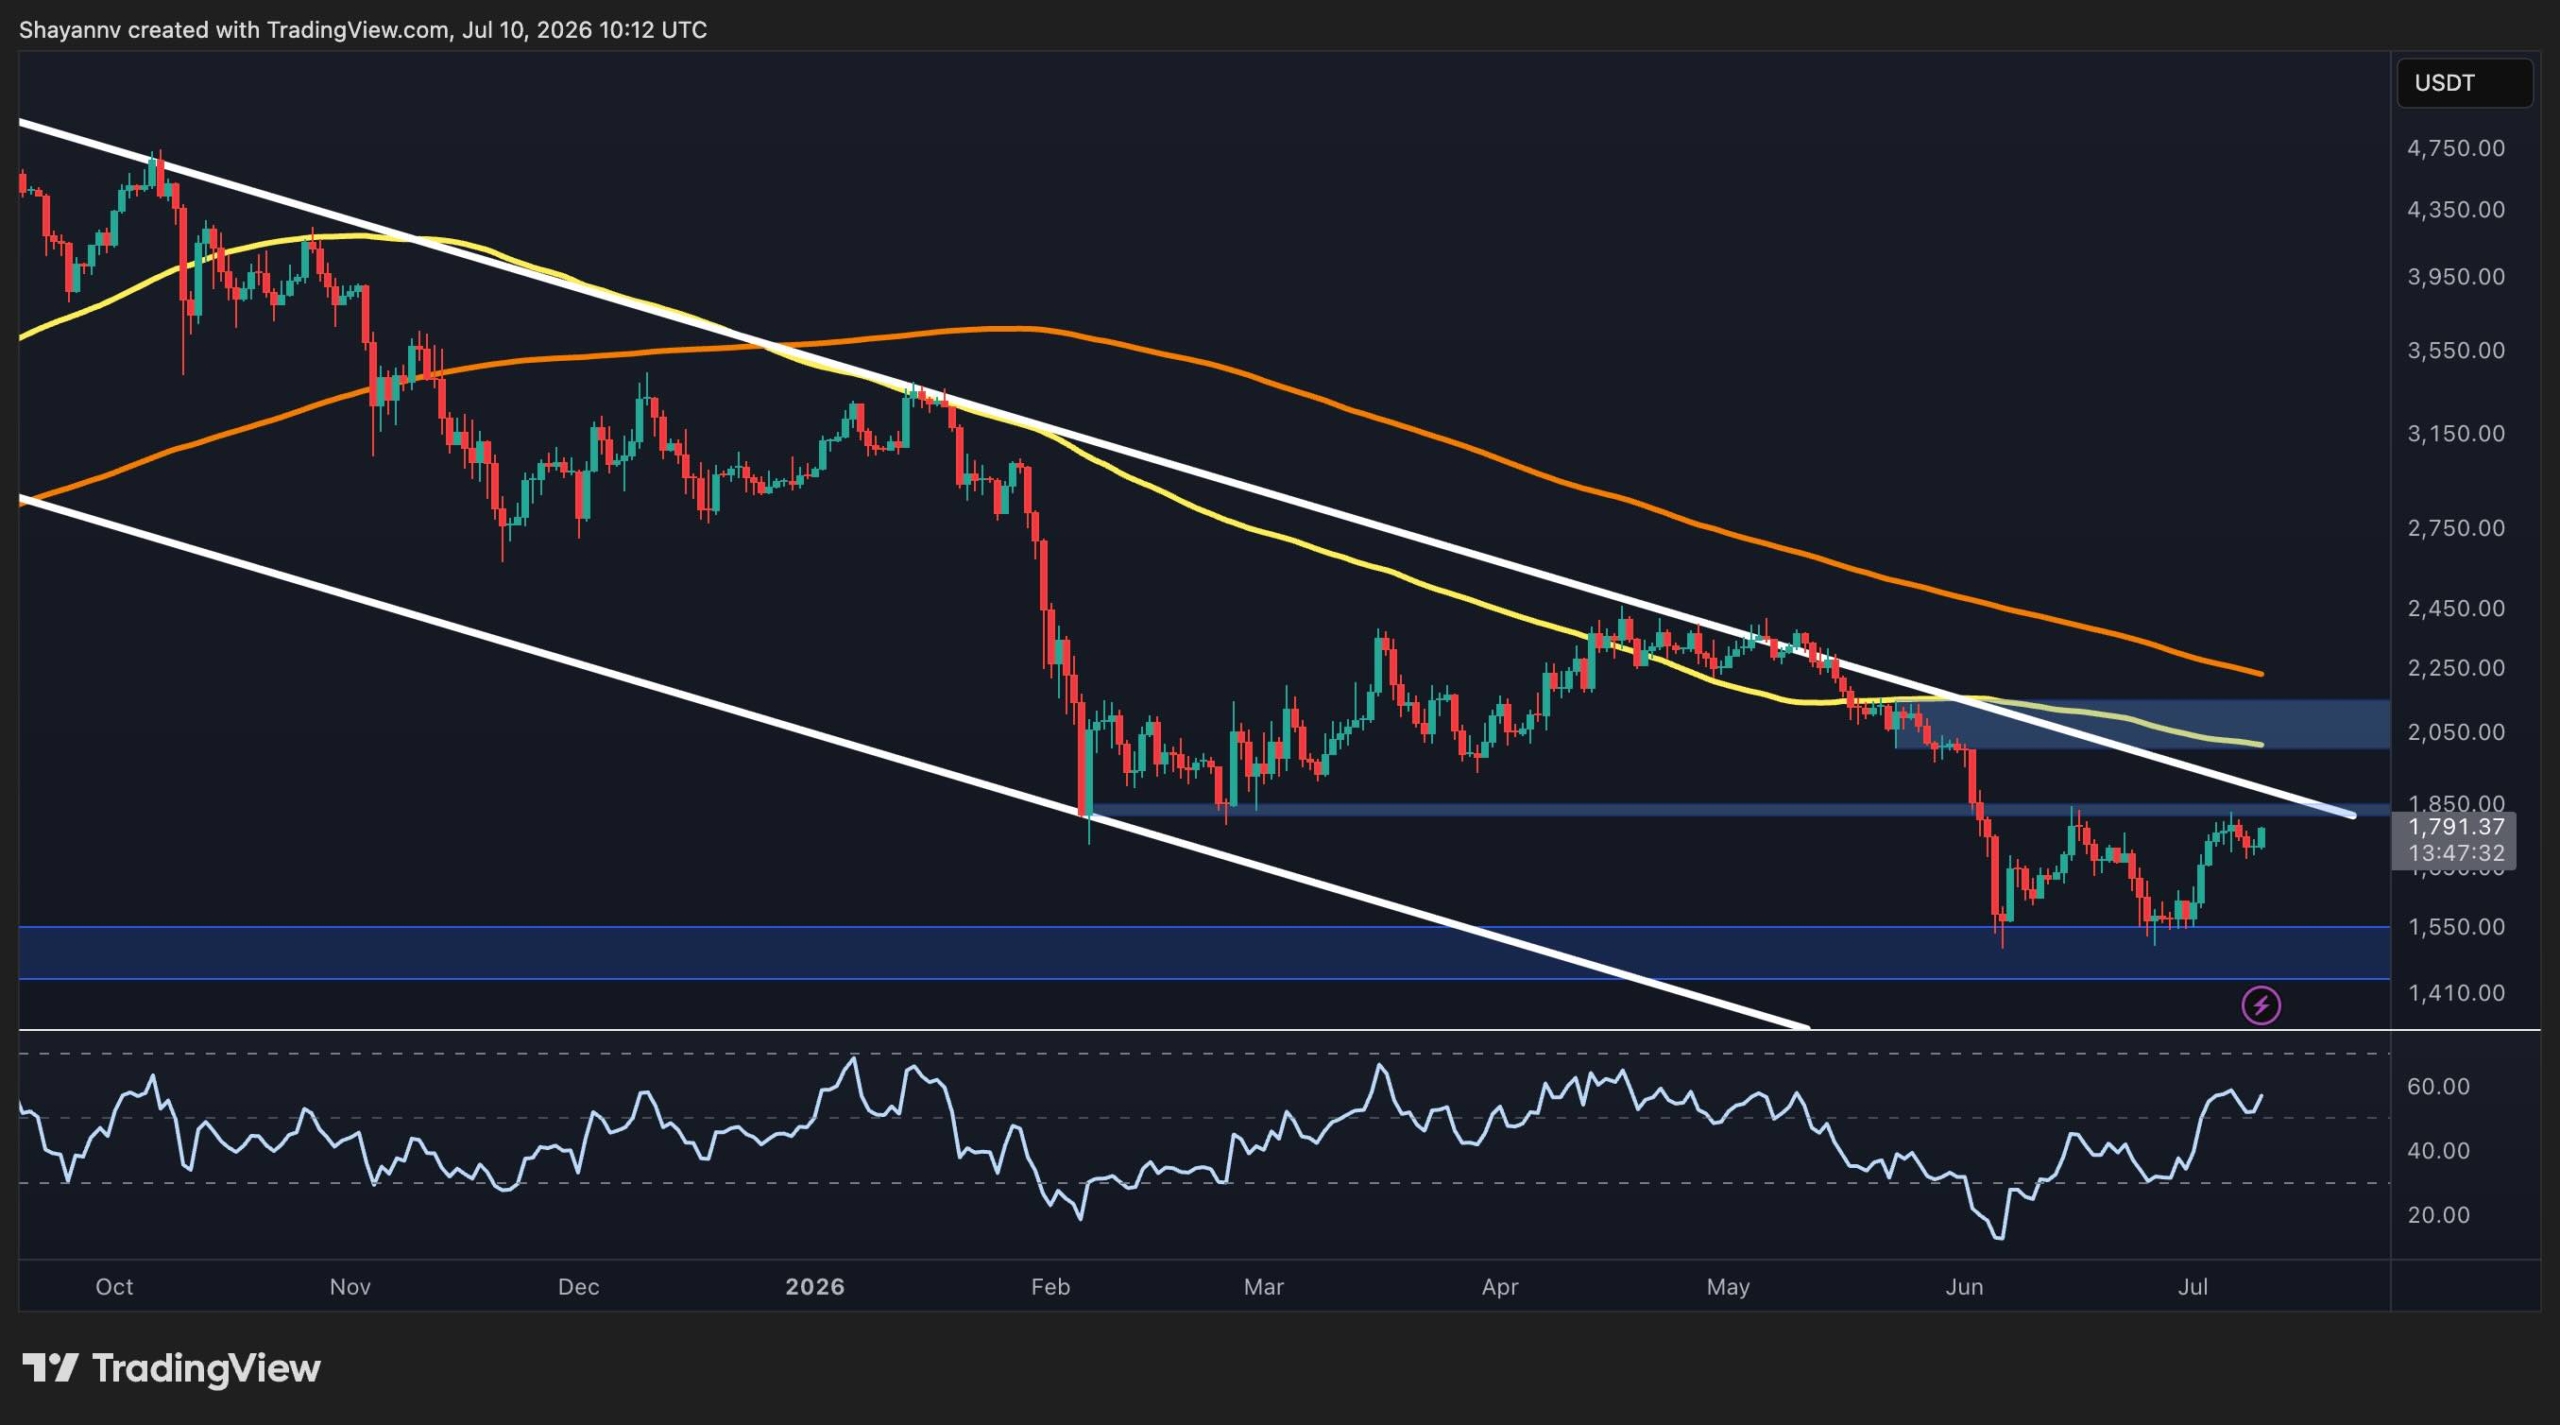
Ethereum Price Analysis: The Daily Chart
On the daily chart, ETH is still trading above the 100-day moving average (~$2.15k), which is currently the only positive sign on this timeframe. The mildly ascending channel from the February low also remains technically intact, and its lower boundary is rising toward $2.1k and will act as another dynamic support level.
In This News
Coins

$ 1.79K
+2.87%
$ 1.79K
+3.07%Predictions Markets
See what traders are focused on
Share:
In This News
Coins
$ 1.79K
+2.87%$ 1.79K
+3.07%Predictions Markets
See what traders are focused on
Share:
Read More
Ethereum Price Analysis: ETH Faces a Crucial Test After Latest Rebound