/
Cryptocurrency News Aggregator
Latest cryptocurrency news, market analytics, and forecasts from leading global publications: CoinDesk, Cointelegraph, BeInCrypto, Watcher.Guru, U.Today and others
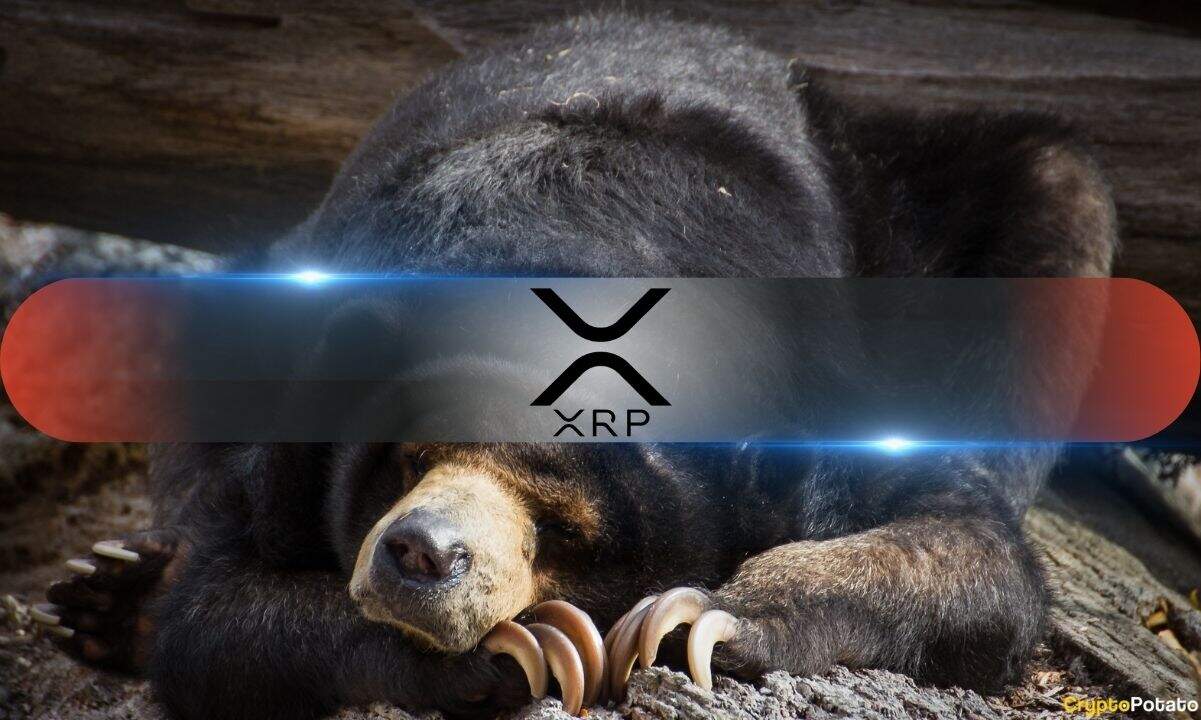
XRP’s On-Chain Data Flashes Warning While Sellers Continue to Dominate
XRP sellers retain the upper hand as investor participation fades and recovery signals remain limited.
Jul 10, 2026
< 1 min read
by CryptoPotato

Bitcoin zips higher to nearly $64,000 as chip rally and yen strength drive gains
Bitcoin is up 4.2% over seven days that contained an oil shock, a bond selloff and two rounds of U.S. strikes on Iran.
Jul 10, 2026
by CoinDesk
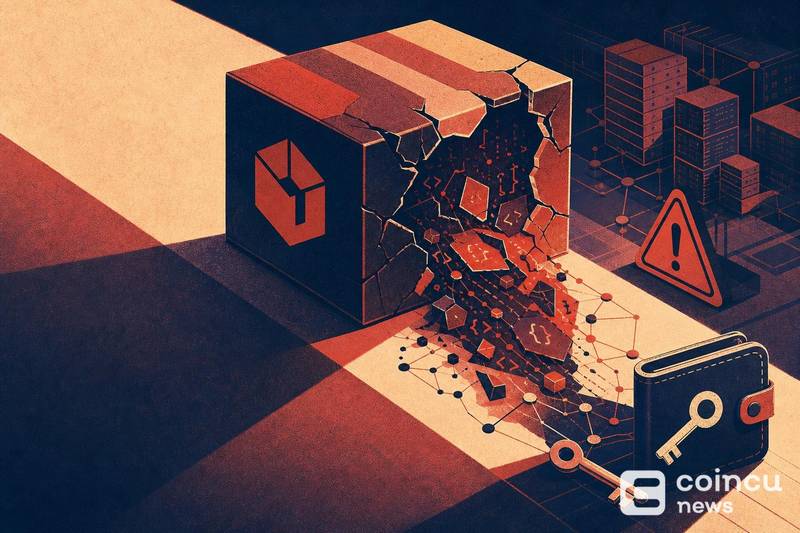
Injective npm Package Attack Exposes Risk to Wallet Private Keys
Attackers backdoored the official Injective TypeScript SDK on npm, inserting code into 18 packages that captured wallet private keys and seed phras...
Jul 10, 2026
by CoinCu News

Wells Fargo increased its Strategy and Ethereum holdings, cut back on some Bitcoin ETFs
🚨 Wells Fargo raised its Strategy and $ETH holdings while scaling back on major Bitcoin ETFs.
Continue Reading:Wells Fargo increased its Strategy ...
Jul 10, 2026
by COINTURK NEWS

Charles Hoskinson Addresses Rumors He Is Quitting Cardano
In Brief
Charles Hoskinson denies rumors he is retiring from Cardano.
Viral clips falsely claimed he said Cardano is failing.
ADA trades near $0.1...
Jul 10, 2026
2 min read
by BeInCrypto

The US-Iran Ceasefire Was an Illusion. Markets are Paying the Price
In Brief
The US-Iran ceasefire was a temporary pause that left the core disputes unresolved.
Renewed tensions around the Strait of Hormuz are alre...
Jul 10, 2026
4 min read
by BeInCrypto

WD-40 Greases Wall Street’s Expectations With Blowout Q2 Beat
In Brief
WD-40 stock jumped as much as 14.5% after Q2 revenue and EPS both beat Wall Street estimates.
Revenue rose 24.3% year over year to $195.1...
Jul 10, 2026
2 min read
by BeInCrypto

Solana’s stablecoin market explodes by 154%! What details are fueling this surge?
🚀 Solana’s stablecoin market has grown by 154% since early 2025.
Continue Reading:Solana’s stablecoin market explodes by 154%! What details are fu...
Jul 10, 2026
by COINTURK NEWS
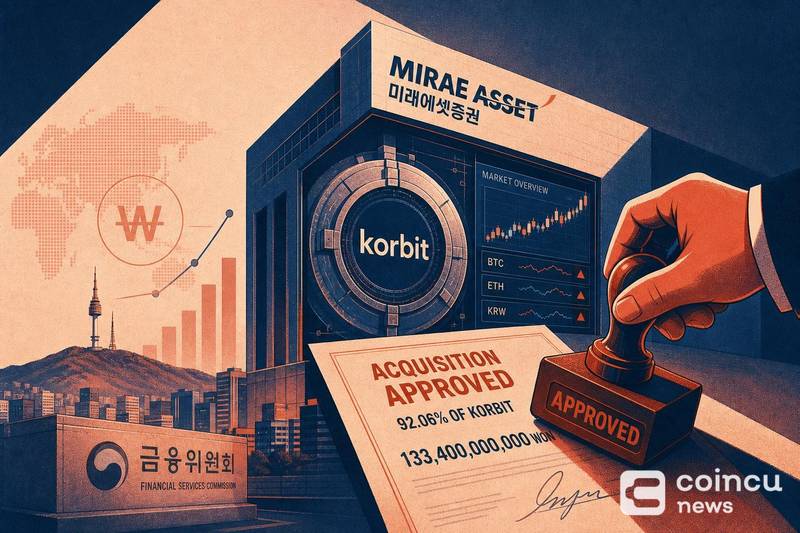
Mirae Asset Approved to Buy 92.06% of Korbit for 133.4B Won
Mirae Asset Group has received approval to acquire a 92. 06% stake in South Korean cryptocurrency exchange Korbit for 133.
Read more...
Jul 10, 2026
by CoinCu News

Goldman Sachs Limits, but Doesn’t Stop, Employees Using Kalshi and Polymarket
In Brief
Goldman Sachs told staff to keep prediction market bets to sports and entertainment only.
Repeated violations of the new policy could cos...
Jul 10, 2026
1 min read
by BeInCrypto