


Bitcoin Price Analysis: Is BTC About to Crash Below $60K Again?
Bitcoin’s price is experiencing a downtrend at the moment, as it has failed to continue its rally above $70K. This begs the question if the bull market has come to a halt or if that’s just a temporary correction.
Technical Analysis
By TradingRage
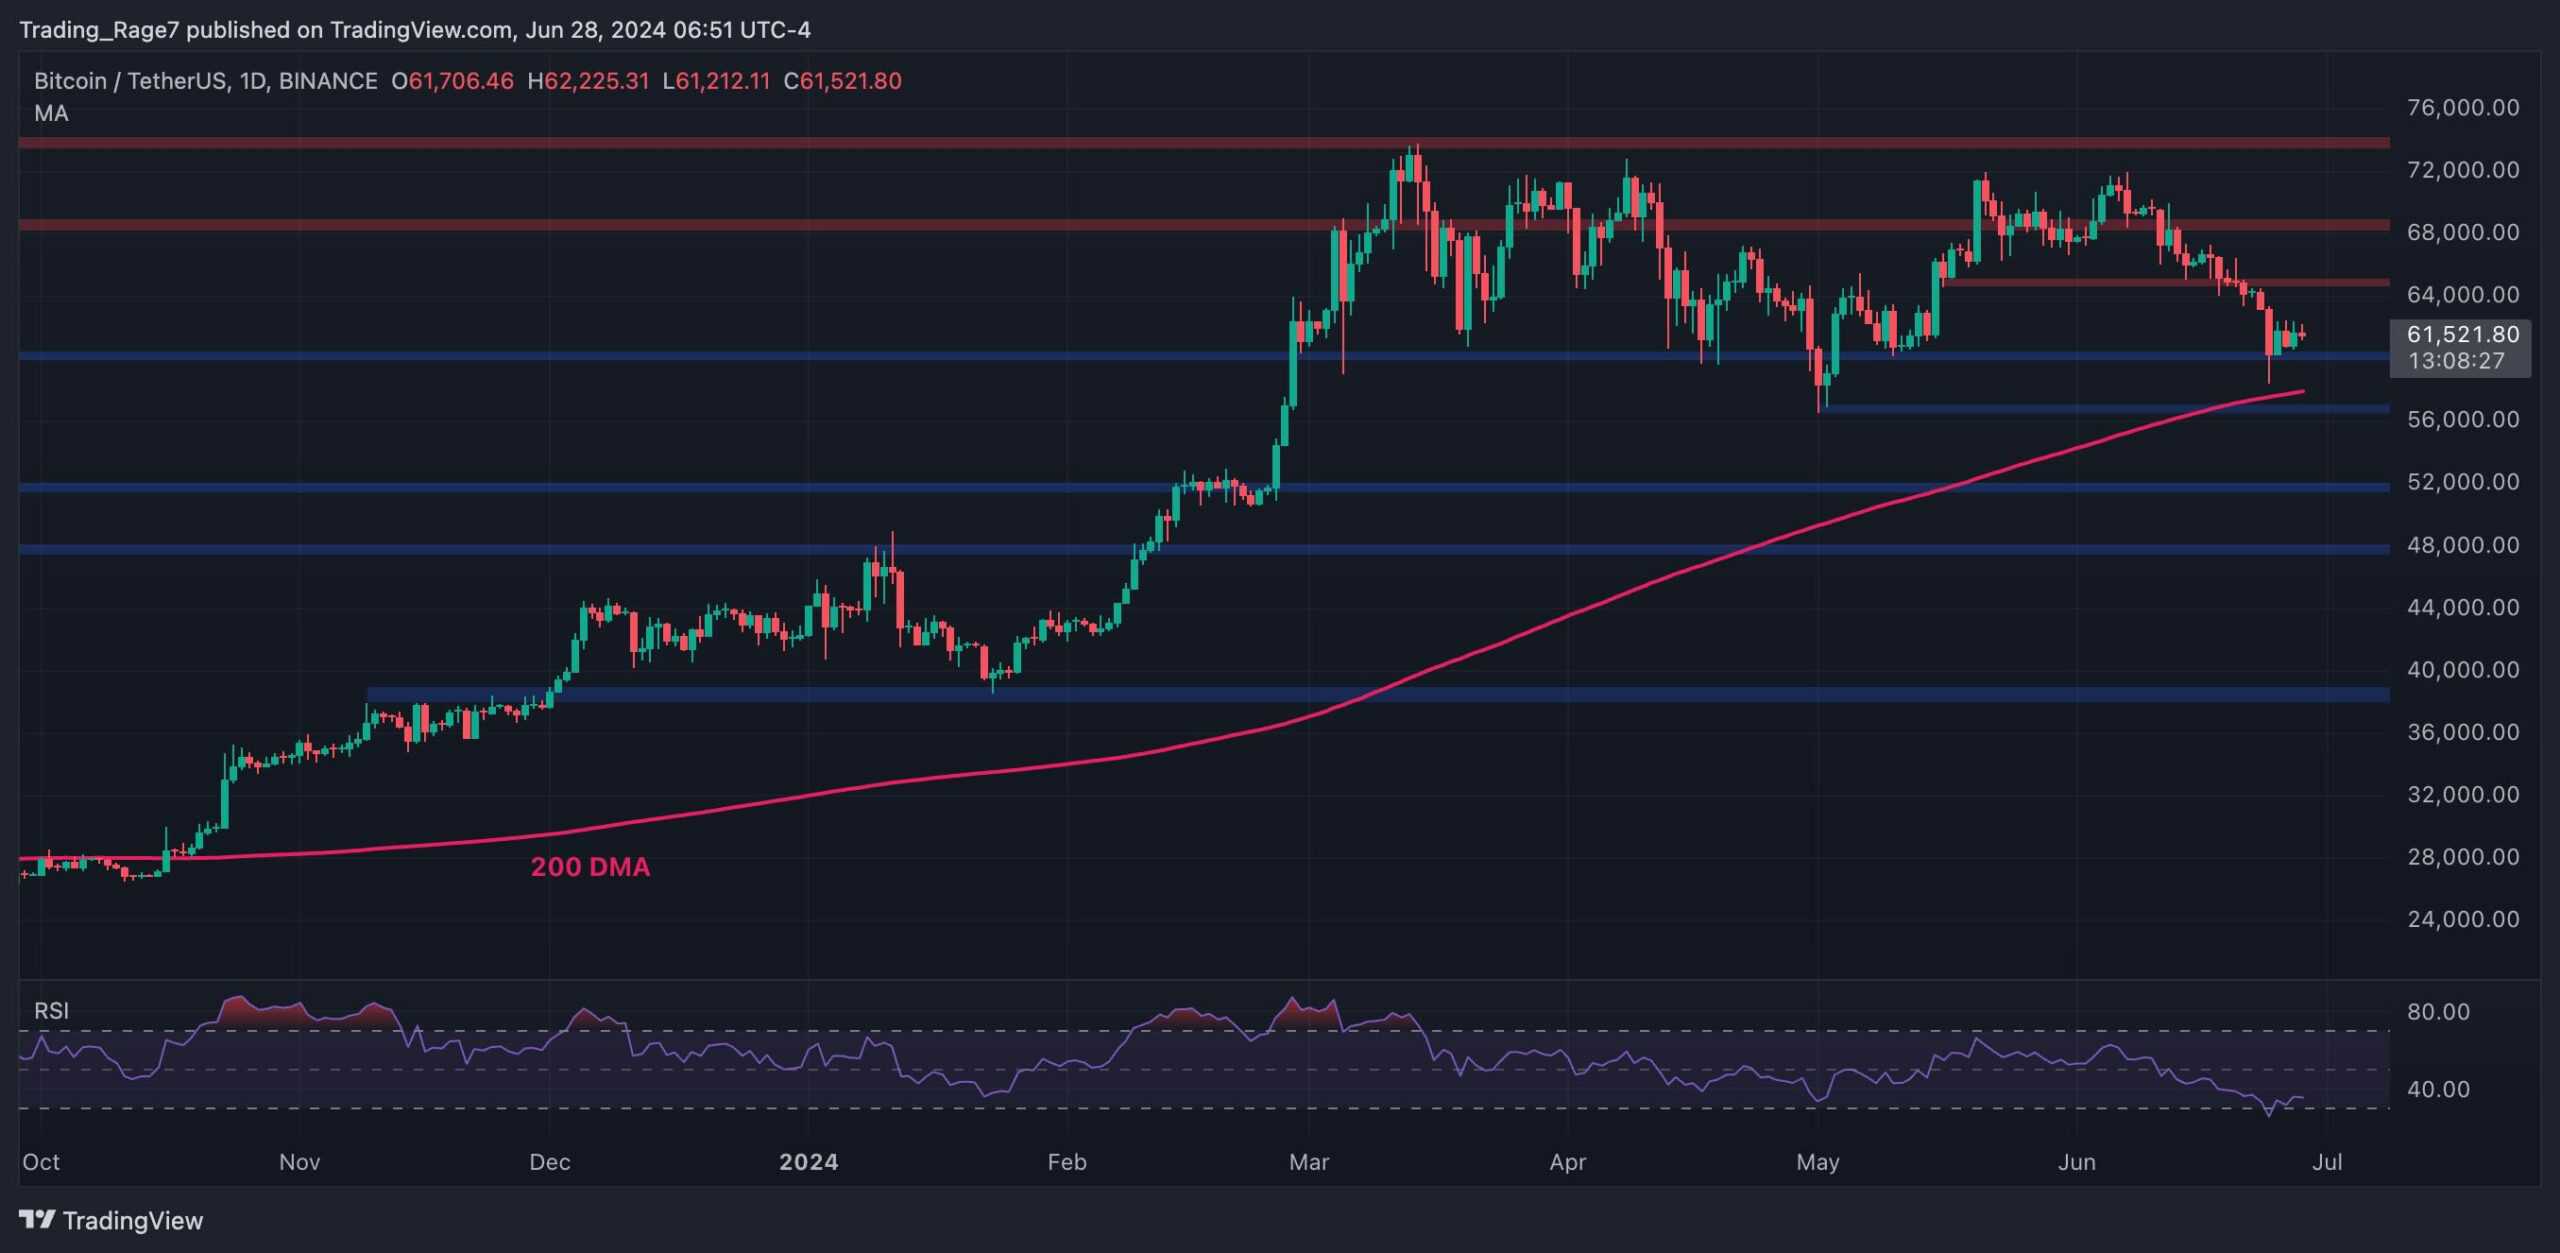
The Daily Chart
As the daily chart demonstrates, Bitcoin’s price has failed to rise above the $75K resistance zone multiple times and is currently declining. The $65K support has also been lost, but the key $60K level currently holds the price.
The 200-day moving average is also located around $57K and could support the market if $60K breaks down. Overall, the trend can still be considered bullish while BTC is trading above its 200-day moving average.
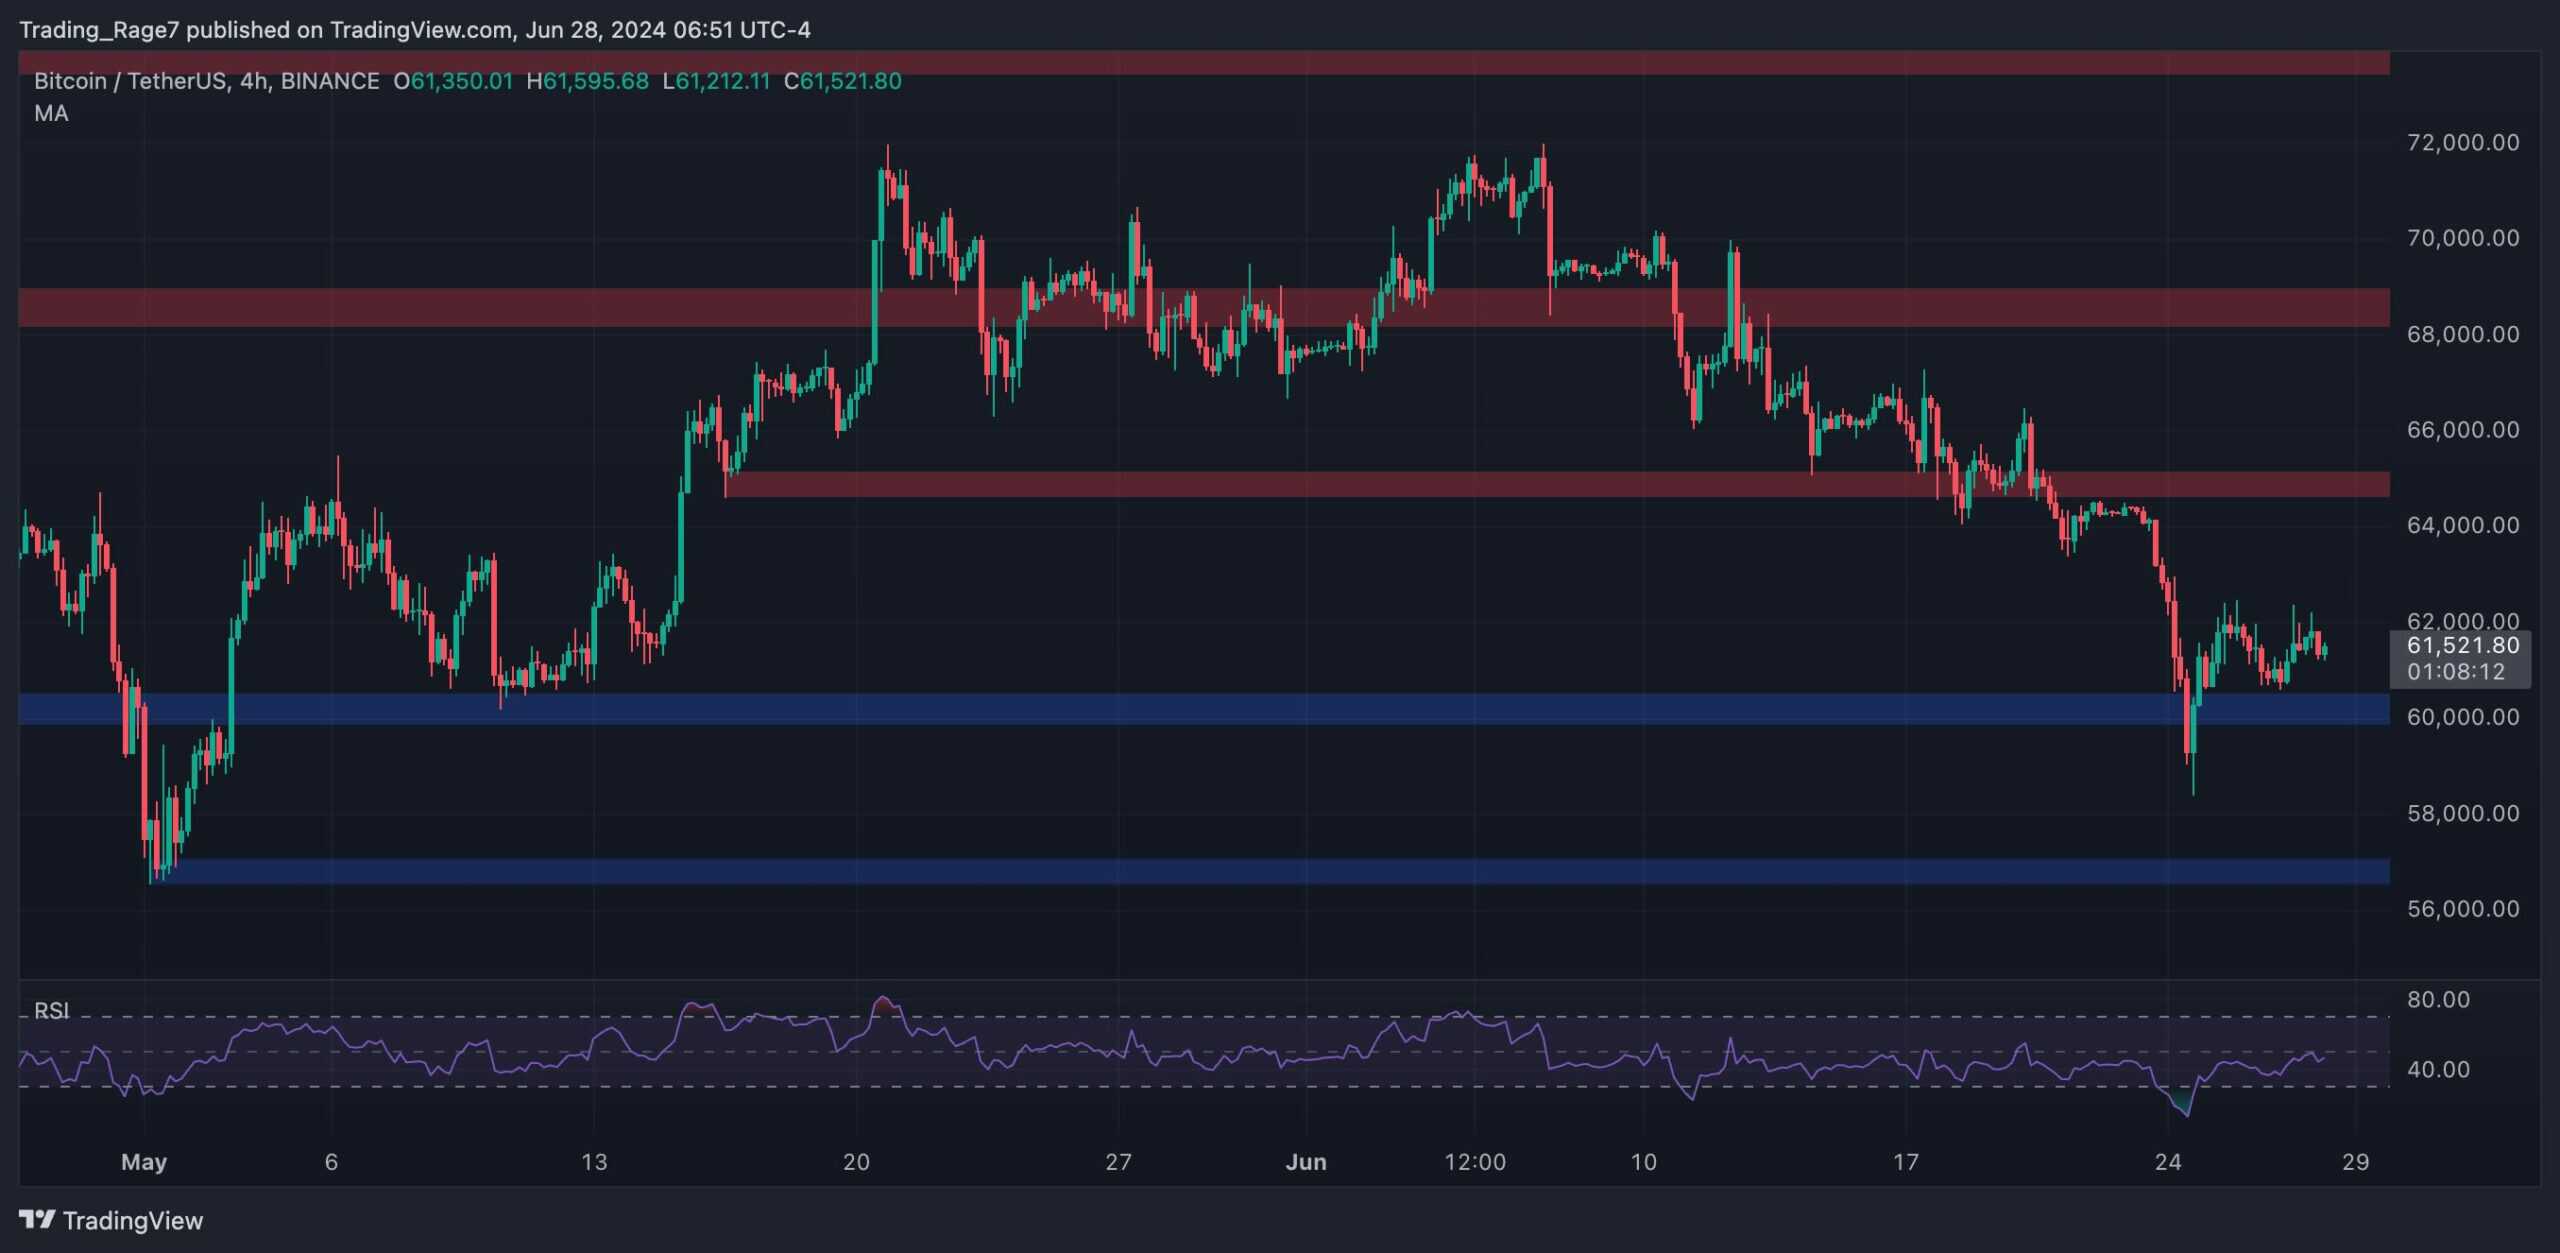
The 4-Hour Chart
The 4-hour chart shows that the price briefly broke below the $60K support level a few days ago but quickly climbed back above. This is a classic fake breakout behavior and could indicate a rally toward the $65K level in the short term.
Yet, the RSI is still showing values below 50%, which means that the momentum is still in favor of the sellers. So, a drop below the $60K level is still possible.
On-Chain Analysis
By TradingRage
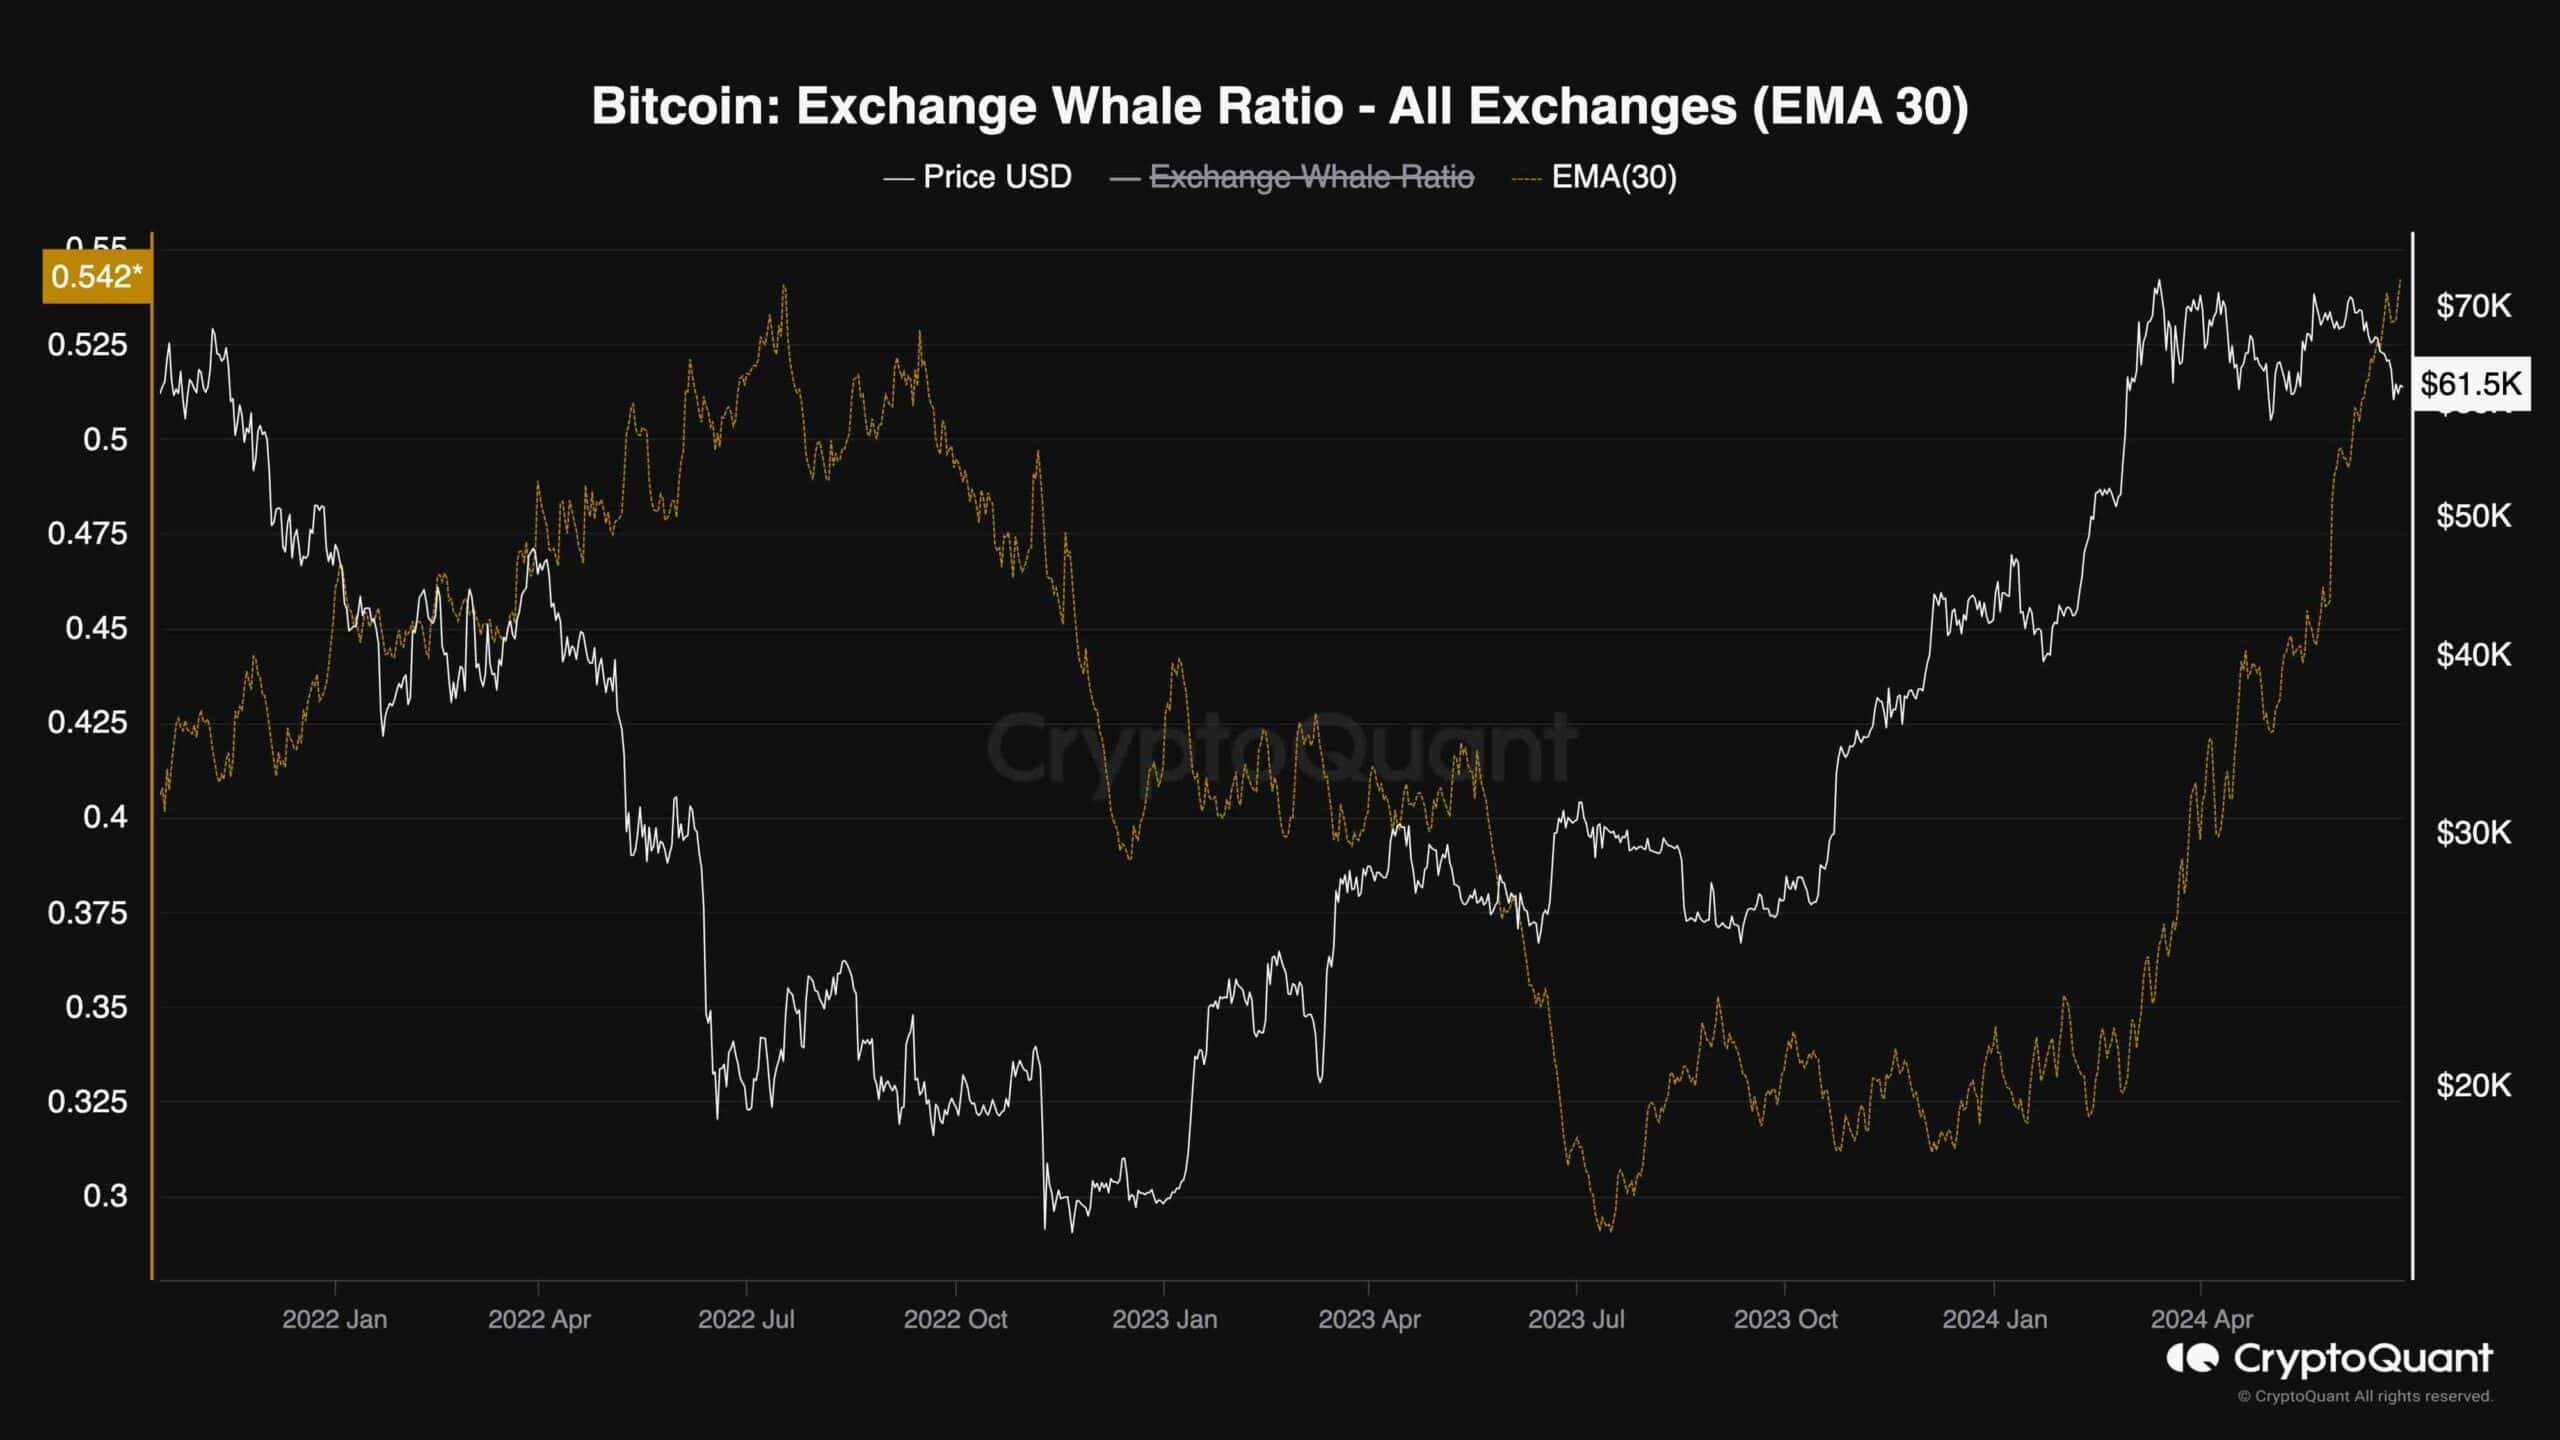
Bitcoin Whale Ratio
Analyzing Bitcoin on-chain metrics can be very helpful in situations where the market is seemingly reversing. This chart demonstrates the BTC whale ratio metric, which measures the ratio of large deposits to the exchanges and assumes that they belong to the whales.
So, higher readings might indicate that Bitcoin whales are depositing their coins to exchanges aggressively, which is likely for selling.
It is evident that the whale ratio has recently reached values higher than 0.5, which is significantly high. This indicates that the whales are selling their coins in considerable volumes. Therefore, if this trend continues, Bitcoin’s price might drop even lower as the market would be overwhelmed with excess supply.
The post Bitcoin Price Analysis: Is BTC About to Crash Below $60K Again? appeared first on CryptoPotato.
Read More


Bitcoin Price Analysis: Is BTC About to Crash Below $60K Again?
Bitcoin’s price is experiencing a downtrend at the moment, as it has failed to continue its rally above $70K. This begs the question if the bull market has come to a halt or if that’s just a temporary correction.
Technical Analysis
By TradingRage
The Daily Chart
As the daily chart demonstrates, Bitcoin’s price has failed to rise above the $75K resistance zone multiple times and is currently declining. The $65K support has also been lost, but the key $60K level currently holds the price.
The 200-day moving average is also located around $57K and could support the market if $60K breaks down. Overall, the trend can still be considered bullish while BTC is trading above its 200-day moving average.
The 4-Hour Chart
The 4-hour chart shows that the price briefly broke below the $60K support level a few days ago but quickly climbed back above. This is a classic fake breakout behavior and could indicate a rally toward the $65K level in the short term.
Yet, the RSI is still showing values below 50%, which means that the momentum is still in favor of the sellers. So, a drop below the $60K level is still possible.
On-Chain Analysis
By TradingRage
Bitcoin Whale Ratio
Analyzing Bitcoin on-chain metrics can be very helpful in situations where the market is seemingly reversing. This chart demonstrates the BTC whale ratio metric, which measures the ratio of large deposits to the exchanges and assumes that they belong to the whales.
So, higher readings might indicate that Bitcoin whales are depositing their coins to exchanges aggressively, which is likely for selling.
It is evident that the whale ratio has recently reached values higher than 0.5, which is significantly high. This indicates that the whales are selling their coins in considerable volumes. Therefore, if this trend continues, Bitcoin’s price might drop even lower as the market would be overwhelmed with excess supply.
The post Bitcoin Price Analysis: Is BTC About to Crash Below $60K Again? appeared first on CryptoPotato.
Read More