Stellar (XLM) Builds Momentum: Can Bulls Smash $0.378 Resistance?

- XLM is holding $0.35 support, with $0.378 as the next resistance before $0.41.
- Analysts highlight the bull market support band as a critical level to defend.
- A breakout above long-term resistance could fuel a multi-month rally toward $0.50+.
Stellar’s token has been stuck in sideways action for weeks, but the latest setups suggest something big might be brewing. Analysts are pointing to strong support and a tightening range that could soon give XLM the push it needs. If momentum holds, the charts are hinting at a climb toward $0.41 in the short run.
XLM Price Targets and Key Resistance
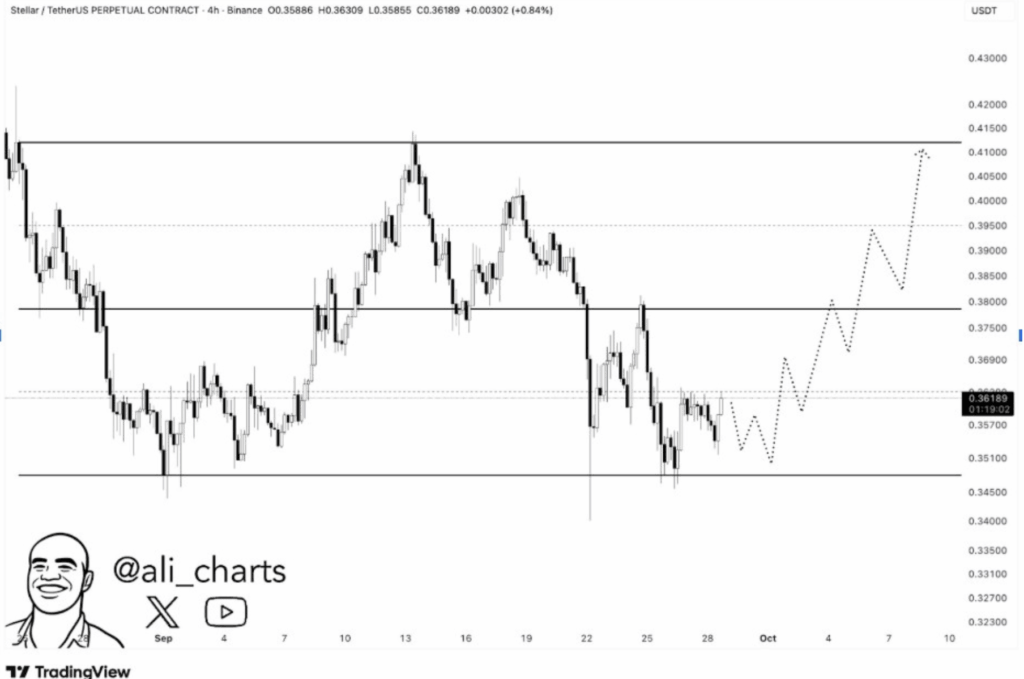
Ali Charts highlighted that Stellar has been forming higher lows while holding firmly above a $0.35 support line. His 4-hour chart showed the first real hurdle sits around $0.378 — a zone where sell orders are stacked. If buyers can slice through that wall, it could unlock a quick rally and confirm a bullish reversal.
The roadmap looks almost step-by-step: defend $0.35, push through $0.378, then aim for $0.41. Ali added that volume will be the deciding factor. Without steady inflows, the setup could fizzle out. But if the bids come in, $0.41 may just be the first checkpoint in a broader run.
Bull Market Support Band in Play
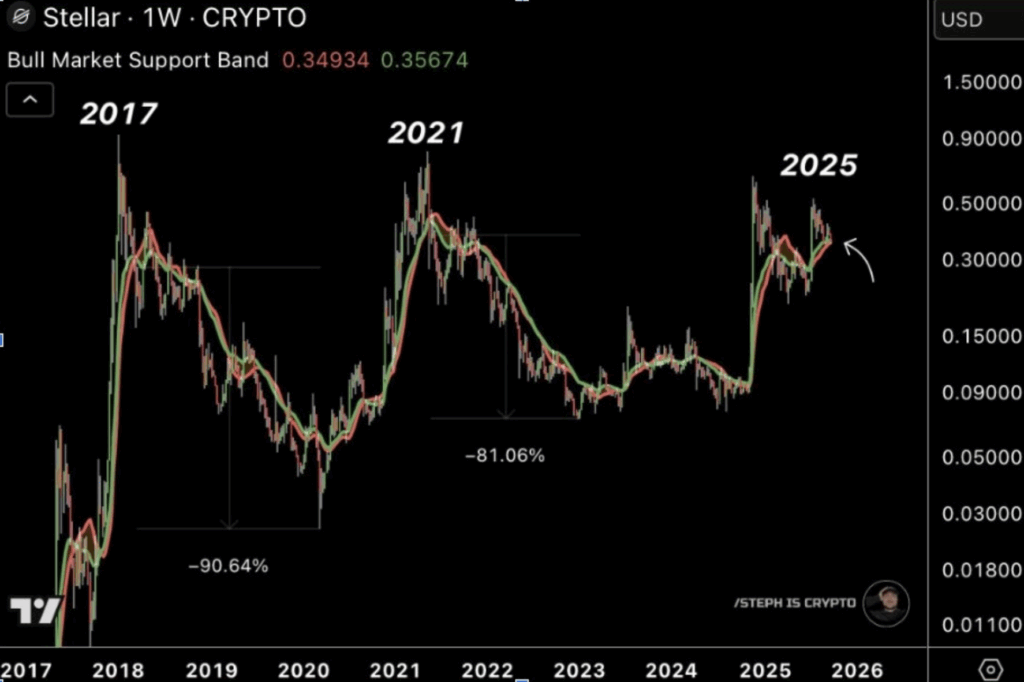
Another analyst, Steph Is Crypto, zoomed out to the weekly chart. He noted that XLM is once again resting on its bull market support band, which sits right near $0.35. Historically, this band has been a launchpad — in both 2017 and 2021 it sparked major rallies when defended.
For Steph, holding above this line is critical. It keeps the bigger bullish cycle alive and reduces the risk of deeper drops. A weekly close under it, though, could flip the script quickly, inviting fresh selling pressure and delaying the next leg up.
Macro Pattern Points to Long-Term Breakout
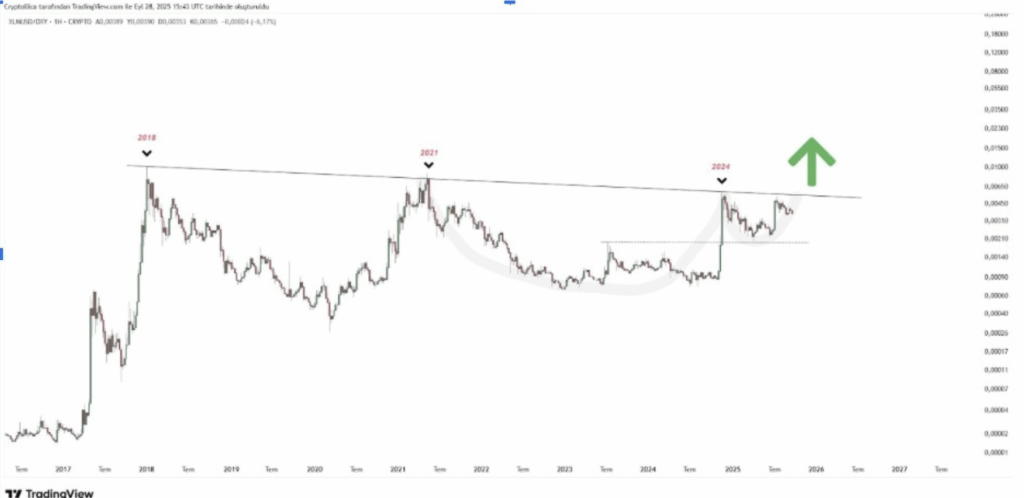
Cryptollica took an even bigger view, pulling up trendlines that stretch back to 2018. XLM has been rejected at the same descending resistance countless times, but the structure now resembles a massive cup-and-handle pattern. According to him, the squeeze is nearing its end.
A strong weekly close above that line could finally break years of compression and kickstart a new multi-month rally. If that happens, XLM might not just test $0.50 but could blast beyond it, setting cycle highs and resetting long-term sentiment.
Sell Walls, Demand Zones, and What Comes Next
CW dug into the order books and confirmed that the sell wall at $0.378 is the first real barrier bulls have to conquer. If they clear it, momentum could snowball toward $0.41 and possibly higher. On the flip side, he marked $0.34–$0.35 as the critical demand zone.
This area has been soaking up selling pressure time and again, acting like a safety net. As long as accumulation continues there, buyers have a strong base to mount fresh rallies. But lose it — especially with weak volume — and the bullish setup gets shaky fast, leaving room for a pullback.
The post Stellar (XLM) Builds Momentum: Can Bulls Smash $0.378 Resistance? first appeared on BlockNews.
Read More


Stellar (XLM) Builds Momentum: Can Bulls Smash $0.378 Resistance?
- XLM is holding $0.35 support, with $0.378 as the next resistance before $0.41.
- Analysts highlight the bull market support band as a critical level to defend.
- A breakout above long-term resistance could fuel a multi-month rally toward $0.50+.
Stellar’s token has been stuck in sideways action for weeks, but the latest setups suggest something big might be brewing. Analysts are pointing to strong support and a tightening range that could soon give XLM the push it needs. If momentum holds, the charts are hinting at a climb toward $0.41 in the short run.
XLM Price Targets and Key Resistance
Ali Charts highlighted that Stellar has been forming higher lows while holding firmly above a $0.35 support line. His 4-hour chart showed the first real hurdle sits around $0.378 — a zone where sell orders are stacked. If buyers can slice through that wall, it could unlock a quick rally and confirm a bullish reversal.
The roadmap looks almost step-by-step: defend $0.35, push through $0.378, then aim for $0.41. Ali added that volume will be the deciding factor. Without steady inflows, the setup could fizzle out. But if the bids come in, $0.41 may just be the first checkpoint in a broader run.
Bull Market Support Band in Play
Another analyst, Steph Is Crypto, zoomed out to the weekly chart. He noted that XLM is once again resting on its bull market support band, which sits right near $0.35. Historically, this band has been a launchpad — in both 2017 and 2021 it sparked major rallies when defended.
For Steph, holding above this line is critical. It keeps the bigger bullish cycle alive and reduces the risk of deeper drops. A weekly close under it, though, could flip the script quickly, inviting fresh selling pressure and delaying the next leg up.
Macro Pattern Points to Long-Term Breakout
Cryptollica took an even bigger view, pulling up trendlines that stretch back to 2018. XLM has been rejected at the same descending resistance countless times, but the structure now resembles a massive cup-and-handle pattern. According to him, the squeeze is nearing its end.
A strong weekly close above that line could finally break years of compression and kickstart a new multi-month rally. If that happens, XLM might not just test $0.50 but could blast beyond it, setting cycle highs and resetting long-term sentiment.
Sell Walls, Demand Zones, and What Comes Next
CW dug into the order books and confirmed that the sell wall at $0.378 is the first real barrier bulls have to conquer. If they clear it, momentum could snowball toward $0.41 and possibly higher. On the flip side, he marked $0.34–$0.35 as the critical demand zone.
This area has been soaking up selling pressure time and again, acting like a safety net. As long as accumulation continues there, buyers have a strong base to mount fresh rallies. But lose it — especially with weak volume — and the bullish setup gets shaky fast, leaving room for a pullback.
The post Stellar (XLM) Builds Momentum: Can Bulls Smash $0.378 Resistance? first appeared on BlockNews.
Read More