Top 100 Coins
Trending Cryptos
Performance
Recently Listed
Gainers
All Categories
All Time High
Blockchains
Global Market Data
Ecosystems
Research
Rewards
Heatmaps
Drop Hunting
Alerts
Converter
Widgets
Market Data API
Futures and Options
Affiliate Program
Ether Price Pumps, But SEC Decisions Could Spoil the Party
Share:

- Ether price up, breakout possible
- Technical indicators signal potential rise
- SEC rulings on ETFs create market uncertainty
Ethereum’s price surged by 5.59% last week, reaching $3,089.25. However, it has experienced a modest decline of 0.56% in the past 24 hours. With a trading volume of $10.95 billion and a market capitalization of $371.1 billion, Ethereum’s market activity is attracting considerable attention.
Technical analysis reveals that the Relative Strength Index (RSI) for Ethereum on the weekly chart sits at 55.47. This value indicates a market that is neither oversold nor overbought. Traders are therefore anticipating potential price movements in either direction. This balanced RSI suggests that the market could soon experience increased volatility.
Furthermore, the Moving Average Convergence Divergence (MACD) indicator on the weekly chart stands at 233.9, suggesting a possible bullish trend reversal. Traders often seek confirmation from other indicators before making investment decisions. Consequently, this MACD signal adds to the anticipation of a potential upward price movement.
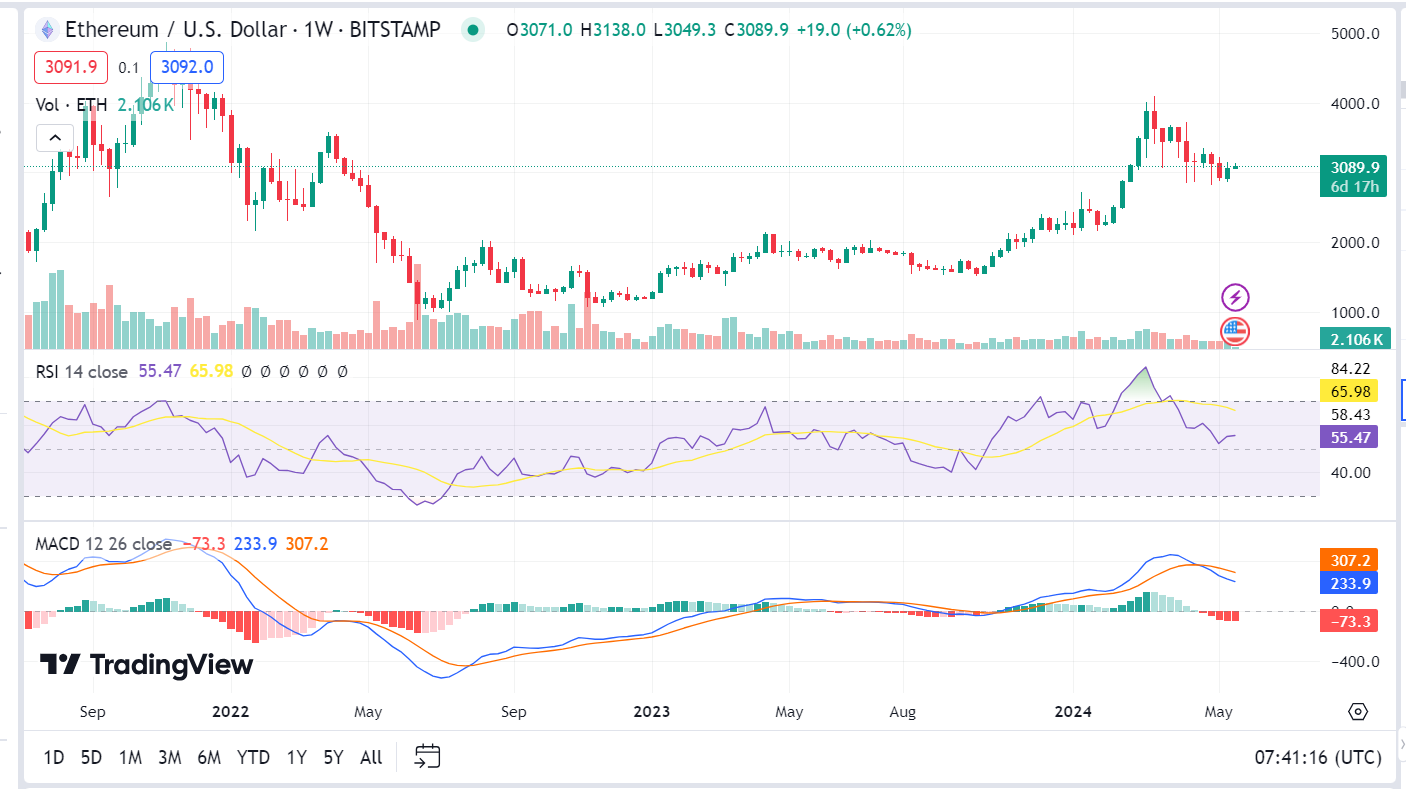
Source: TradingView
The Know Sure Thing (KST) indicator…
The post Ether Price Pumps, But SEC Decisions Could Spoil the Party appeared first on Coin Edition.
In This News
Coins


Funds

Share:
In This News
Coins
Funds
Share:
Read More

Crypto Market Braces for Volatility as BTC, ETH Options Expiry Collides $7.1 Trillion ‘Triple Witching’
Spot Ethereum ETFs Face Alarming Sixth Day of Net Outflows: What’s Driving the Exodus?
Ether Price Pumps, But SEC Decisions Could Spoil the Party
Share:
- Ether price up, breakout possible
- Technical indicators signal potential rise
- SEC rulings on ETFs create market uncertainty
Ethereum’s price surged by 5.59% last week, reaching $3,089.25. However, it has experienced a modest decline of 0.56% in the past 24 hours. With a trading volume of $10.95 billion and a market capitalization of $371.1 billion, Ethereum’s market activity is attracting considerable attention.
Technical analysis reveals that the Relative Strength Index (RSI) for Ethereum on the weekly chart sits at 55.47. This value indicates a market that is neither oversold nor overbought. Traders are therefore anticipating potential price movements in either direction. This balanced RSI suggests that the market could soon experience increased volatility.
Furthermore, the Moving Average Convergence Divergence (MACD) indicator on the weekly chart stands at 233.9, suggesting a possible bullish trend reversal. Traders often seek confirmation from other indicators before making investment decisions. Consequently, this MACD signal adds to the anticipation of a potential upward price movement.
Source: TradingView
The Know Sure Thing (KST) indicator…
The post Ether Price Pumps, But SEC Decisions Could Spoil the Party appeared first on Coin Edition.
In This News
Coins
Funds
Share:
In This News
Coins
Funds
Share:
Read More
Crypto Market Braces for Volatility as BTC, ETH Options Expiry Collides $7.1 Trillion ‘Triple Witching’