
From Retail Frenzy to Selective Capital: The Evolution of Public Token Sales

Share:
 CryptoRank
Share:
Public fundraising remains one of the most transparent indicators of risk appetite in the crypto market. Unlike private venture rounds, IDOs, ICOs, and IEOs reflect direct participation from retail and public investors, making them a useful gauge of market sentiment. Over the past several years, this segment has experienced multiple cycles of expansion and contraction, mirroring broader shifts in liquidity, speculation, and investor confidence across the digital asset industry.
Built with CryptoRank MCP
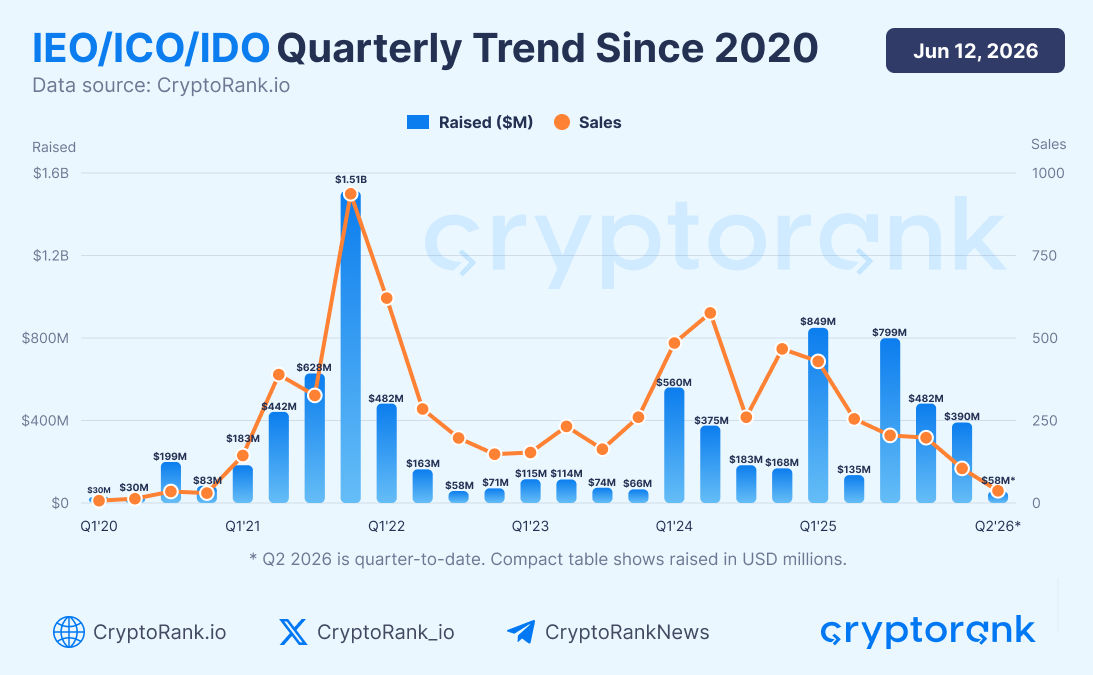
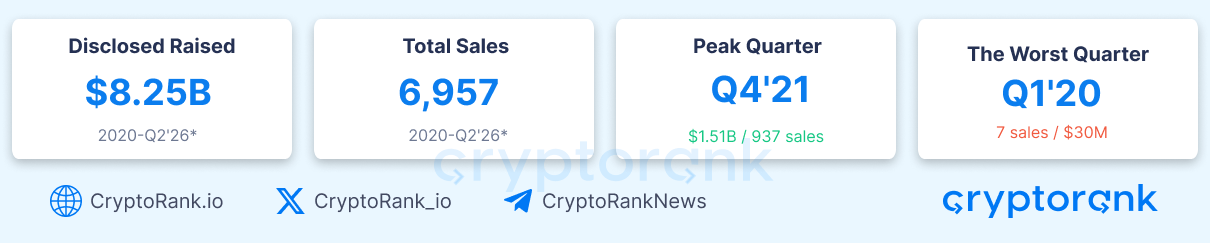
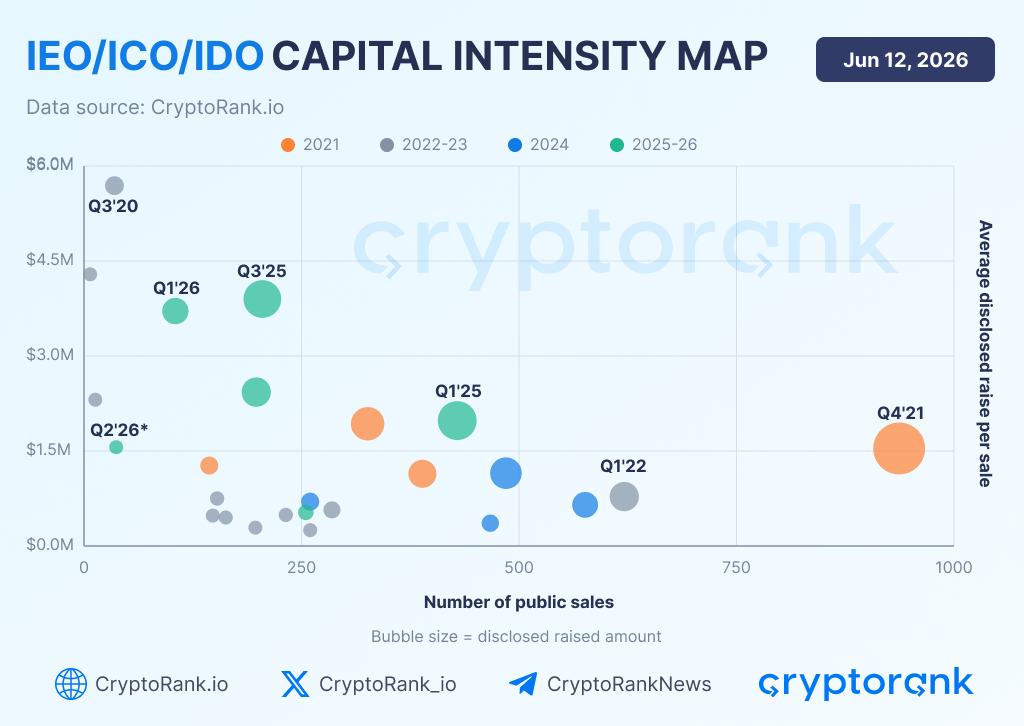
IEOs, ICOs, and IDOs have collectively raised approximately $8.25 billion in disclosed funding across 6,957 public token sales between 2020 and June 10, 2026. The market reached its peak in Q4 2021, when projects raised around $1.51 billion through 937 sales in a single quarter. This was the period of maximum market breadth, characterized by a high number of launches, strong retail participation, and the dominance of the IDO model.
Built with CryptoRank MCP
Annual Cycle
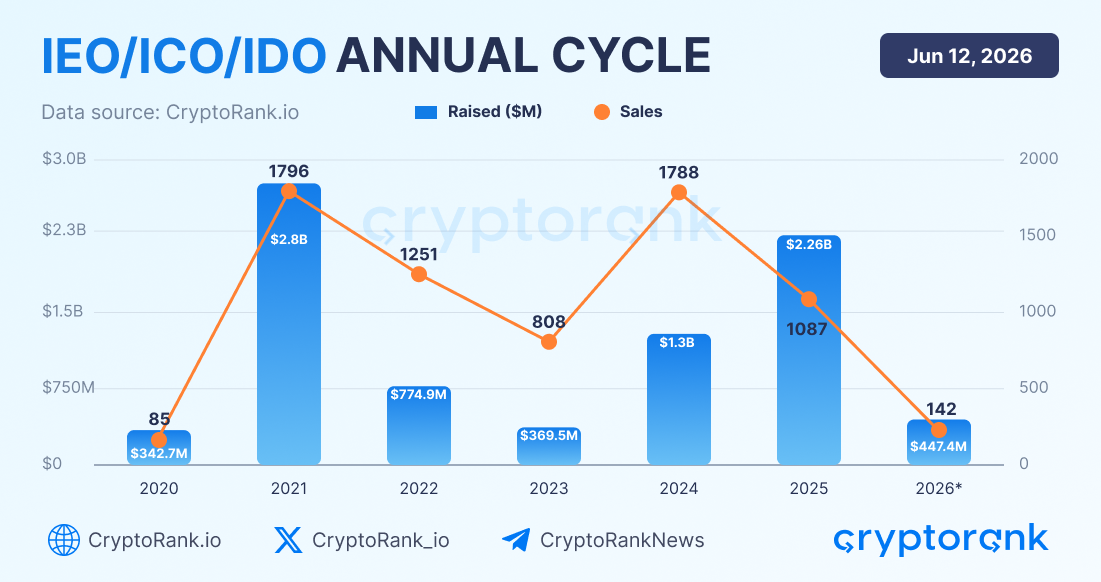
The year 2021 remains the defining phase of the cycle. Public token sales raised approximately $2.77 billion throughout the year, while the number of sales reached 1,796. More importantly, this period marked a structural shift in fundraising dynamics. IDOs accounted for 83.7% of all public rounds by type, effectively replacing the earlier market structure in which ICOs and IEOs occupied a much larger share of fundraising activity.
Built with CryptoRank MCP
2021: The High-Count Era
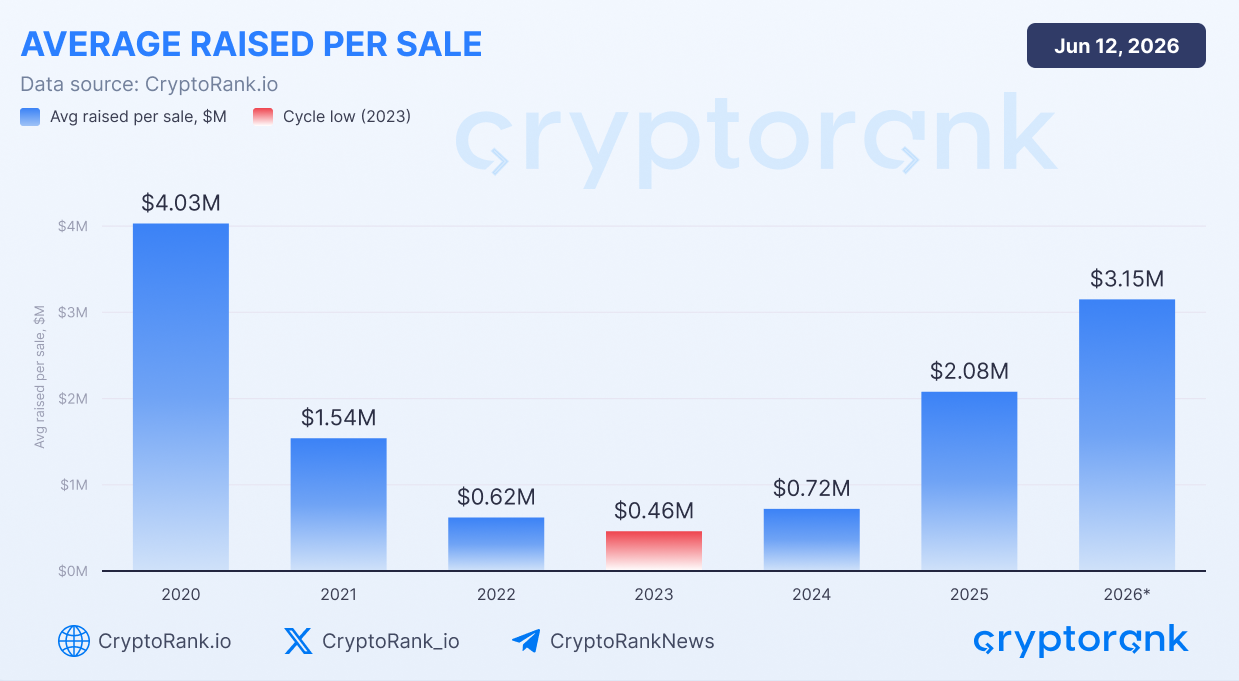
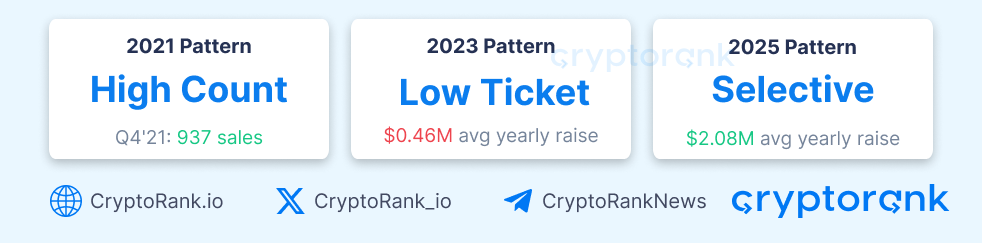
The 2021 was defined by scale. Public sales reached record activity levels, culminating in 937 sales in Q4 2021. At the same time, the average raise per sale remained relatively moderate at around $1.5M.

Built with CryptoRank MCP
This was a classic retail-driven market. Capital was distributed across a large number of launches, while IDOs became the dominant fundraising mechanism. Growth came primarily from the sheer volume of projects entering the market rather than from larger deal sizes.
2022–2023: The Reset Phase
Following the 2021 peak, both fundraising activity and investor appetite contracted sharply.
While the number of sales remained relatively high, the average raise per project collapsed. By 2023, the average disclosed raise had fallen to just $0.46M, the lowest level of the cycle.
Built with CryptoRank MCP
This period reflects a market where projects could still launch, but access to capital became significantly more limited. Investors were increasingly selective, and fundraising rounds became much smaller.
2024: Rebuilding Activity
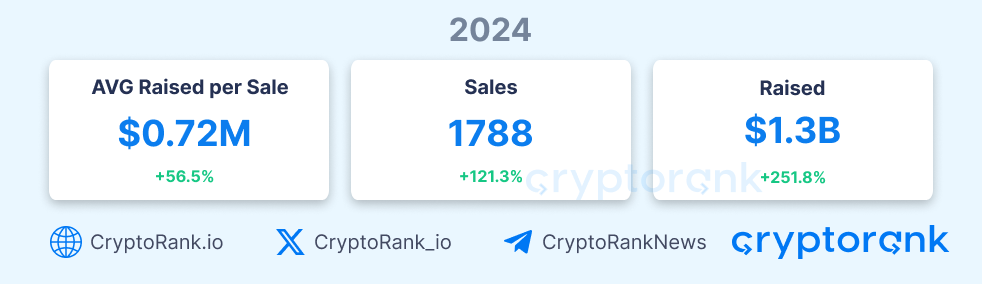
The recovery phase began in 2024.
Built with CryptoRank MCP
The number of public sales rebounded to near-2021 levels, reaching 1,788 sales during the year. However, the average raise per project remained below historical highs.
This suggests that market participation returned before large pools of capital. In other words, activity recovered first, while investor conviction remained relatively cautious.
2025–2026: The Selective Capital Era
The most notable shift occurred in 2025 and has continued into 2026.
Built with CryptoRank MCP
Unlike 2021, the market is no longer characterized by a massive number of launches. Instead, fewer projects are raising capital, but those that succeed are attracting significantly larger allocations.
The average disclosed raise increased to $2.08M in 2025, while 2026 year-to-date has reached $3.15M per sale, the highest level observed during the current cycle.
Built with CryptoRank MCP
This suggests that capital has become increasingly concentrated in a smaller number of higher-conviction opportunities. Rather than funding hundreds of speculative launches, investors appear to be focusing on a select group of projects with stronger fundamentals, clearer product-market fit, or greater strategic importance.
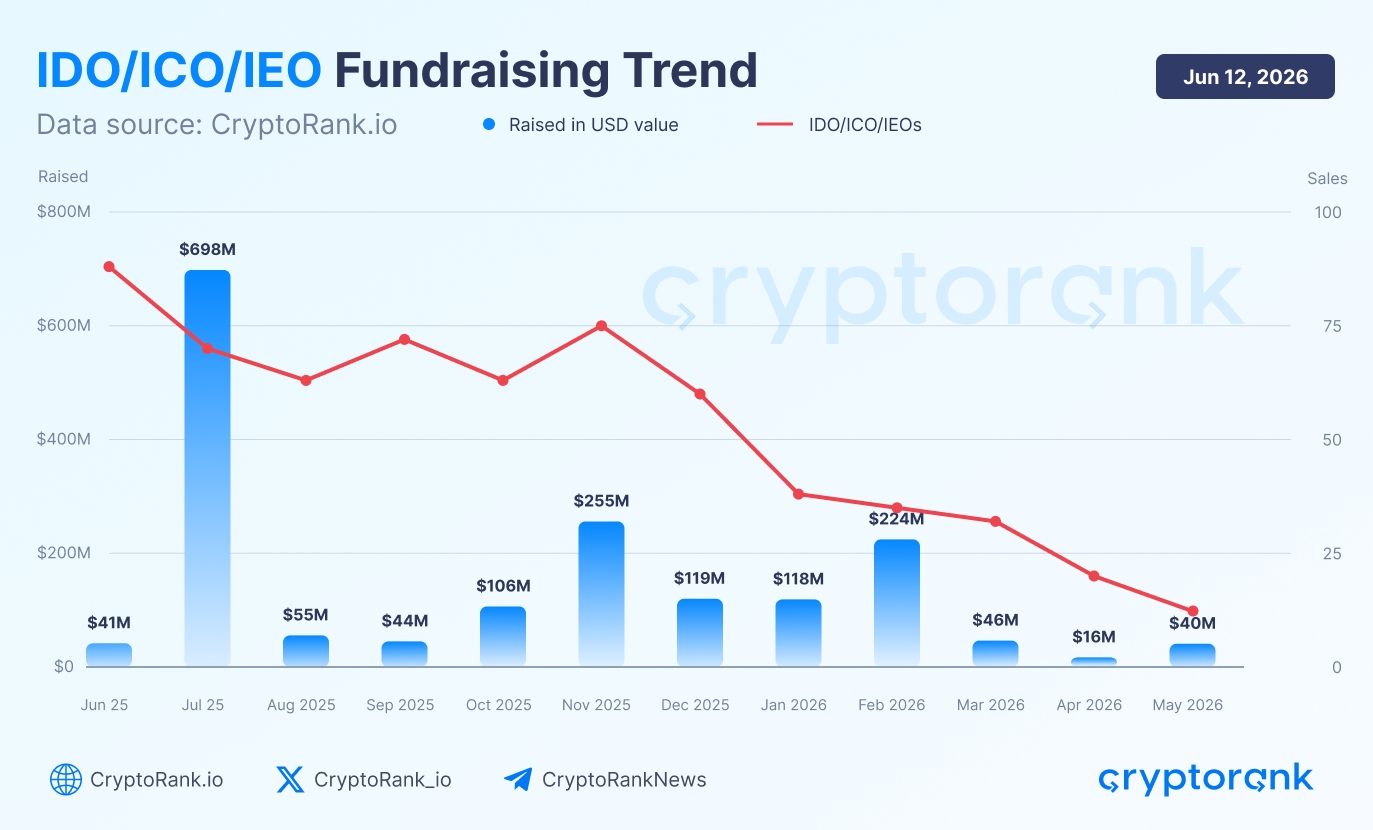
An additional signal of market weakness is the decline in launch activity. Only 13 public token sales were recorded in May 2026, the lowest monthly figure since November 2020, when the market saw just 4 sales.
Built with CryptoRank MCP
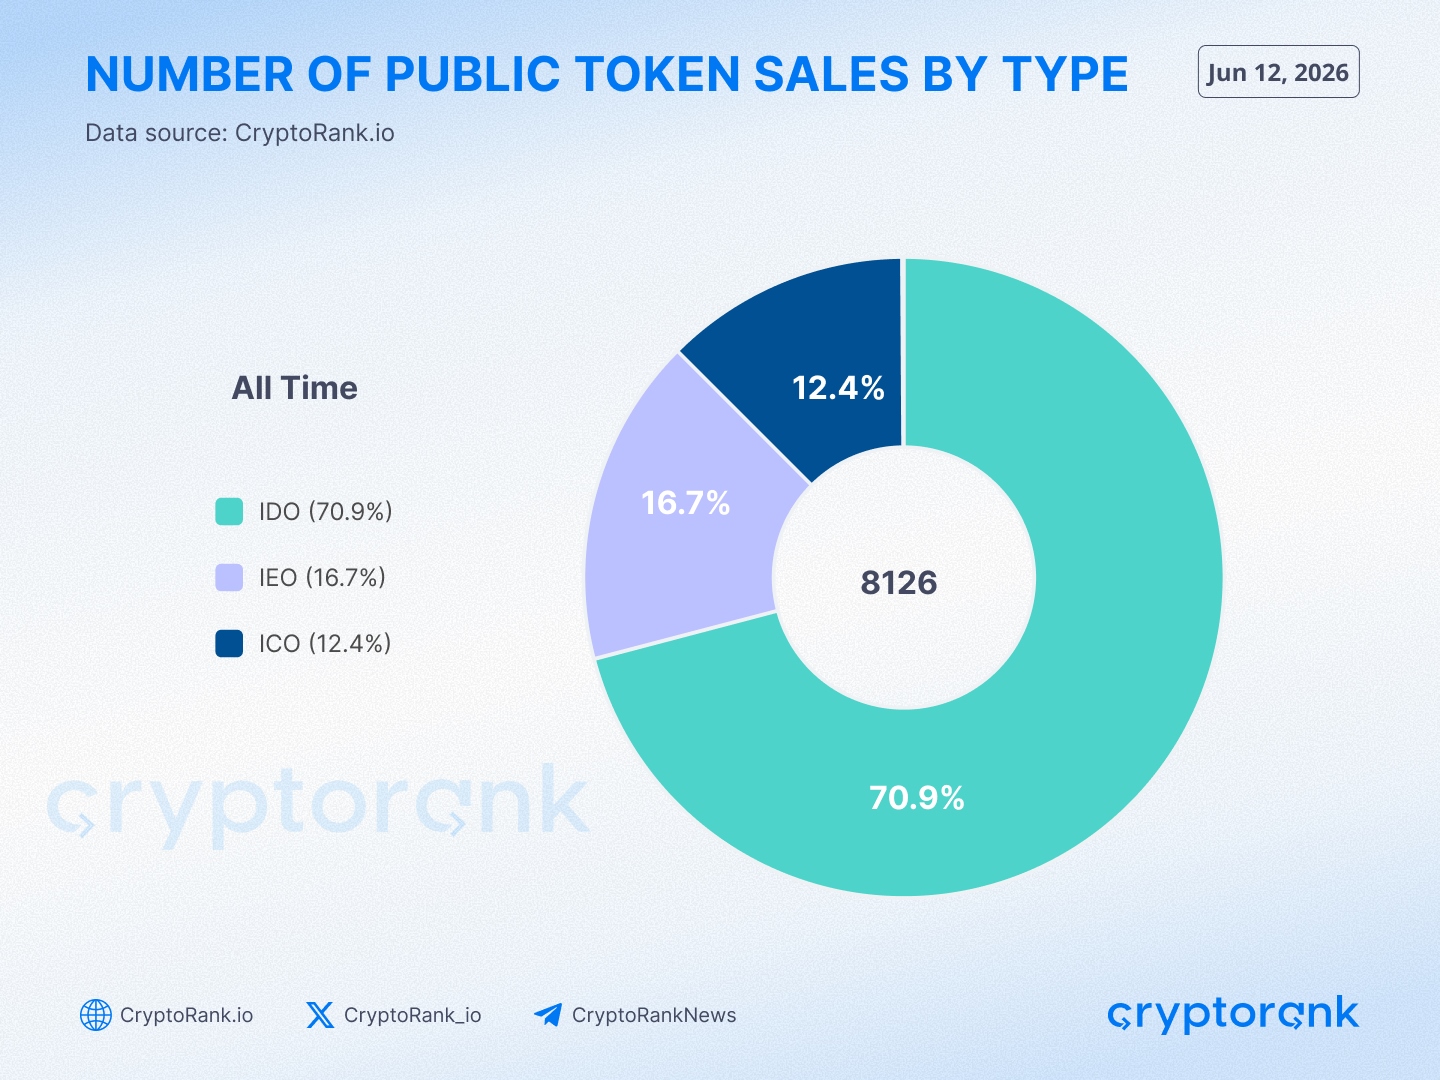
IDOs Continue to Dominate the Public Sale Market by Number of Sales
Another important aspect of the market has been the dominance of IDOs by number of public sales.
Built with CryptoRank MCP
A total of 8,126 public token sales have been conducted since 2020, distributed as follows:
- IDO — 70.9%
- IEO — 16.7%
- ICO — 12.4%
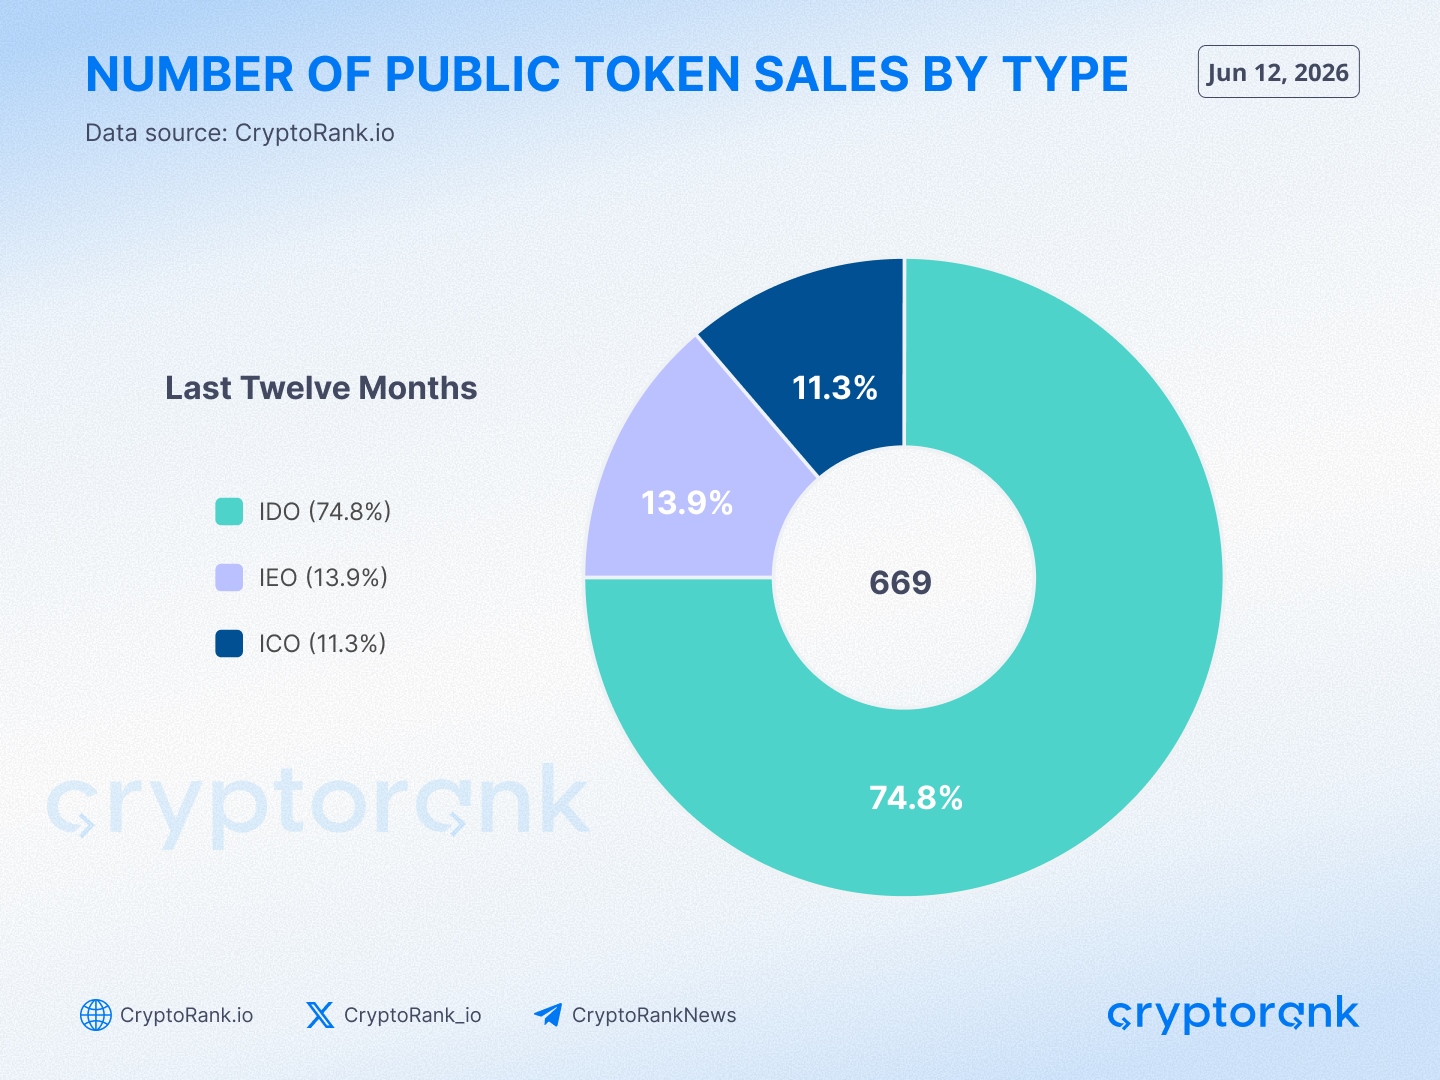
The trend has become even more pronounced recently, with IDOs accounting for approximately 75% of all public token sales over the past year.
Built with CryptoRank MCP
Despite significant changes in the public sale landscape, the overall structure remains remarkably consistent. Today, roughly 7 out of every 10 public fundraising rounds are conducted through the IDO model, reinforcing its position as the dominant fundraising mechanism in the crypto industry.
Launchpad Leaders: Where Capital Has Been Concentrated
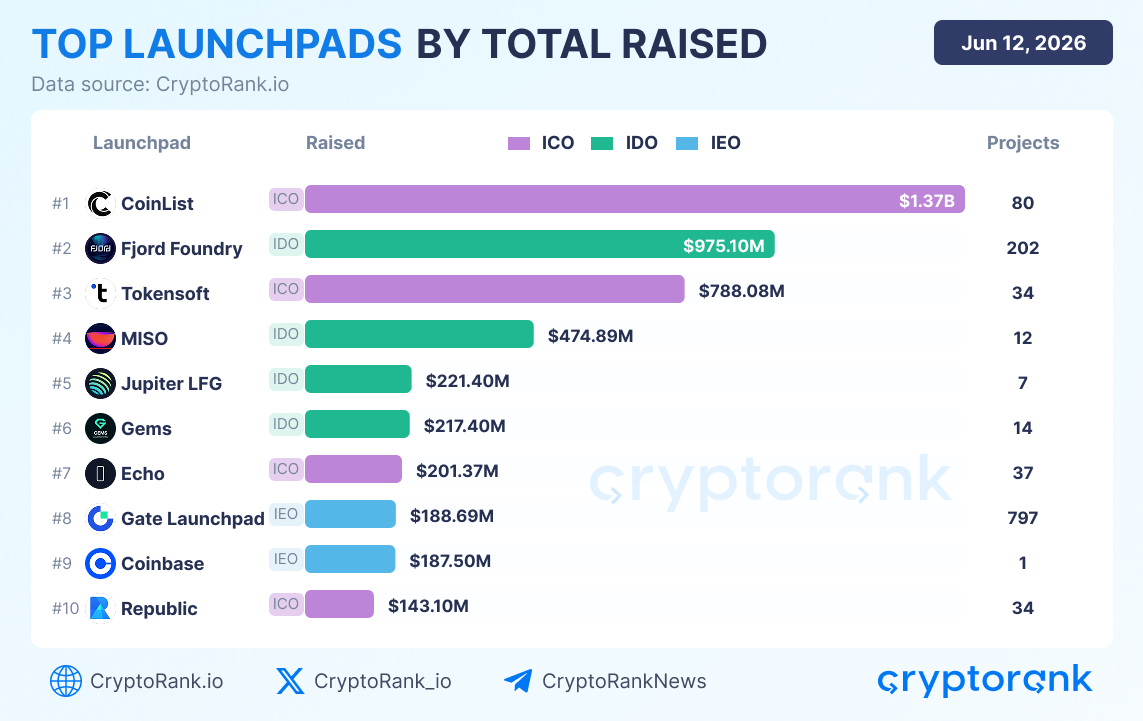
While the number of public sales provides a broad view of market activity, fundraising platforms reveal where capital has actually been concentrated throughout the cycle.
Built with CryptoRank MCP
CoinList remains the largest public sale platform by total disclosed capital raised, having facilitated approximately $1.37B across 80 projects. Despite launching significantly fewer projects than many competitors, CoinList continues to attract some of the industry's largest fundraising rounds.
The second position is occupied by Fjord Foundry, which has raised nearly $975M through 202 projects, highlighting the growing role of IDO-focused platforms in the current market structure. Tokensoft follows with approximately $788M raised across 34 projects.
Built with CryptoRank MCP
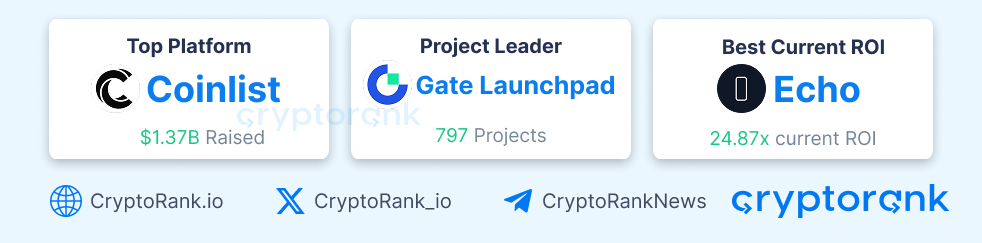
An interesting contrast emerges when comparing capital raised with project count. While CoinList leads by fundraising volume, Gate Launchpad ranks first by number of launches, having hosted 797 projects. This illustrates the difference between platforms focused on high-profile, capital-intensive offerings and those optimized for scale and distribution.
The data also shows that leadership is no longer determined solely by fundraising volume. Return performance increasingly matters.

Built with CryptoRank MCP
Among the top launchpads, Echo currently delivers the highest average ROI at 24.87x, significantly outperforming larger and more established competitors. Meanwhile, Gems and CoinList maintain strong performance with 5.66x and 3.14x ROI respectively.
Overall, the launchpad landscape reflects the broader evolution of the public sale market: capital has become more concentrated, investors have become more selective, and platform quality increasingly matters as much as fundraising volume itself.
Conclusion
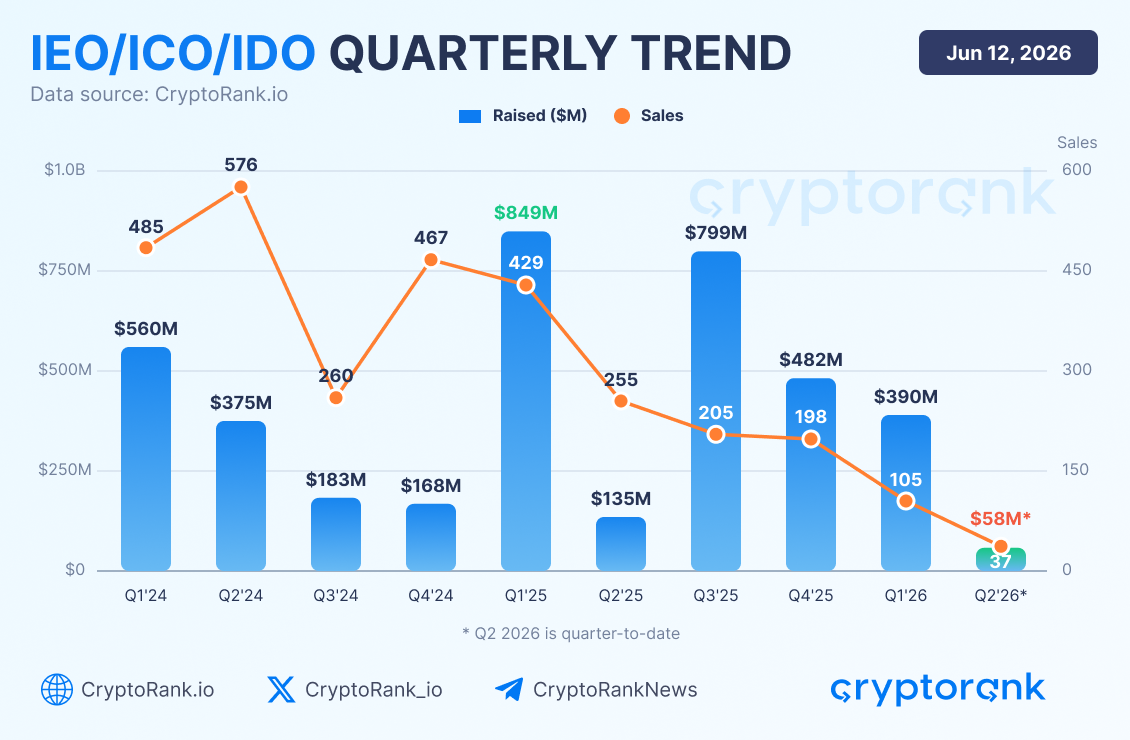
The IEO/ICO/IDO market has not disappeared — it has evolved. In 2021, it served as a mass-market capital formation engine largely driven by retail participation. During 2022–2023, the market underwent a deep contraction. In 2024, launch activity began to recover, while 2025–2026 marked a transition toward a more concentrated, capital-intensive, and selective fundraising environment.
Equally important are the number of public sales, and the average raise per project.
Although the long-term trend points to a steady decline in the number of public sales, retail interest in ICOs, IDOs, and IEOs tends to re-emerge during favorable stages of the market cycle.
Built with CryptoRank MCP
Historically, periods of improving market sentiment and expanding risk appetite have often been accompanied by renewed participation in public token offerings.
At the same time, public fundraising has become increasingly concentrated over time. Rather than being distributed across hundreds of smaller launches, capital is now flowing into a narrower group of projects, reflecting a more selective approach from both investors and fundraising platforms.