Table of Contents
- Introduction
- How It Works
- What’s under the hood of the Fear and Greed Index?
- Volatility (25%)
- Market Impulse and Volumes (25%)
- Social Media (15%)
- Dominance (10%)
- Google Trends (10%)
- Retrospective Analysis of the Effectiveness of the Fear and Greed Index
- Practical Recommendations for Using the Fear and Greed Index
What’s under the hood of the Fear and Greed Index?


Introduction
“Be fearful when others are greedy, and greedy when others are fearful.” – Warren Buffett.
Almost every investor is familiar with this quote or has at least heard the general idea that the market often moves against the sentiment of the crowd. This holds true for traditional financial markets and even more so for the cryptocurrency market, where heightened volatility leads to more extreme emotional swings. For this reason, the tool we will discuss in this article—the Fear and Greed Index—has gained significant popularity, particularly in the crypto market. This indicator provides a way to view market conditions from an “outside perspective”, helping participants recognize their own potential states of euphoria, greed, or excessive fear, thus avoiding critical mistakes made under emotional influence. But have you ever wondered how the Fear and Greed Index works? What drives it? How effective is it? If so, we invite you to explore these questions in this article.
How It Works
The Fear and Greed Index (hereafter referred to as “FGI”) operates as an oscillator, meaning it fluctuates between a minimum and maximum value:
• Minimum value = 0: This represents moments of maximum possible fear in the market. In practice, this value has never been reached (the lowest FGI reading was 6, recorded on August 19, 2022).
• Maximum value = 100: This signifies moments of maximum possible euphoria in the market. Similarly, this value has never been recorded (the highest reading reached 95 on several occasions).
Apart from these extreme values, the FGI is divided into four sectors:
• 0 to 25 = Extreme Fear (buying opportunity)
• 25 to 50 = Fear (consider buying)
• 50 to 75 = Greed (consider selling)
• 75 to 100 = Extreme Greed (selling opportunity)

But how exactly are these values calculated? What are the input data for FGI calculations?
What’s under the hood of the Fear and Greed Index?
The Fear and Greed Index is a composite indicator—it consists of several metrics, each measured independently, after which all metrics are combined. Each metric has its own “weight” in the index calculation, meaning some metrics contribute more than others. Below, we will describe each metric included in the index and indicate its weight in the calculation in parentheses after its name.
Volatility (25%)
The FGI measures the volatility and maximum drawdowns of Bitcoin’s price, then compares these metrics to their average values over the past 30 and 90 days. The FGI interprets abnormal increases in volatility as a sign of fear in the market.
Interestingly, the way the FGI interprets volatility directly contradicts how it is viewed in classical technical analysis, as exemplified by the early 20th-century trader Richard Wyckoff (yes, the same Wyckoff whose accumulation and distribution models traders love to overlay on their favorite cryptocurrency charts).
From the FGI’s perspective, high volatility is a sign of fear in the market—a bullish signal. In contrast, Richard Wyckoff described high volatility as one of the main signs of distribution, a purely bearish signal.
It’s no wonder there’s a saying among traders: “Buy during low volatility, sell during high.”
In defense of the FGI, it’s worth noting that it doesn’t consider volatility itself as much as “maximum Bitcoin price drawdowns.” Indeed, the deeper and sharper Bitcoin’s price falls, the more frightened market participants become. However, this does not always indicate a “sell-off climax.” From the perspective of classical technical analysis, even significant and sharp price drops are often not good buying opportunities; on the contrary, they may signal the beginning of a strong bearish trend that could last longer than the patience of early buyers.
Market Impulse and Volumes (25%)
The FGI evaluates current trading volumes and market momentum, comparing them to their average values over the past 30/90 days. The FGI interprets high daily buying volumes in a “positive market” as symptoms of greed.
Interestingly, this again contradicts the principles of classical technical analysis, which views rising volumes in a “positive market” as a sign of a genuine trend, while declining volumes are seen as a sign of a weak or false trend. In fact, as we will see later, this particular metric seems to be responsible for some of the FGI’s overly “premature” signals.
Social Media (15%)
The FGI collects and counts posts with various hashtags for each coin on Twitter (X) and tracks the speed and volume of posts related to specific coins within defined time frames. Spikes in such activity, according to the FGI, indicate increased public interest in a coin, which they interpret as a sign of greed in the market.
This is hard to argue with. One only needs to recall the state of Twitter in March of this year, when any remotely notable influencer could post their public SOL address and say: “Send me your $SOL for the $X token presale.” Overall, activity in the so-called “crypto Twitter” was off the charts: timelines were flooded with mentions of various tickers, charts, and screenshots of green PnL figures. Looking back, we can clearly say this was a strong indicator of a greedy market.
The problem, however, lies in the relatively small weight this metric holds in the final FGI calculation—only 15%, compared to the 25% weight of the previous, much more controversial metrics.
Dominance (10%)
The FGI includes Bitcoin dominance ($BTC.D) in its calculations. In theory, high Bitcoin dominance reflects market participants’ preference for safety and a lack of speculative interest, which is interpreted as a signal of fear. Conversely, low Bitcoin dominance suggests growing greed, as investors shift to riskier altcoins in anticipation of the next major bull rally.
Again, it’s hard to disagree. High Bitcoin dominance, all else being equal, indicates restrained market sentiment, as altcoin growth is typically associated with a full-fledged bull market. However, there is an important nuance that can significantly impact the usefulness of this metric.
The FGI takes the dominance value from the BTC.D index calculated by TradingView. However, this index does not reflect the actual dominance of Bitcoin, as it is calculated simply by dividing Bitcoin’s market capitalization by the market capitalization of the top 125 coins. If you look at the dominance value displayed on the header of cryptorank.io, it differs significantly from BTC.D, as it includes the market capitalization of all coins listed on the site (over 30,000). Since the total number of coins in the market is even higher (and no one knows exactly how many), we never truly know the precise value of Bitcoin dominance. This can, in some cases, negatively impact the informativeness of the FGI.
Google Trends (10%)
The final metric of the FGI is the analysis of data from Google Trends. The index not only collects “Bitcoin-related” queries but also considers their context. For example, the index’s website mentions that if people frequently search for “Bitcoin price manipulation,” the FGI interprets this anomaly as a sign of fear in the market.
Arguably, this parameter is the most challenging to analyze and assess. Its effectiveness is difficult to either confirm or refute. Given this and the low weight of this factor (10%), we will not dwell on it in detail.
The math doesn’t add up.
A careful reader may notice that we have finished listing the metrics included in the FGI calculation, but their total weight does not add up to 100%:
- Volatility – 25%
- Momentum and trading activity – 25%
- Social sentiment – 15%
- Bitcoin dominance – 10%
- Search trend analysis – 10%
- Total: 25% + 25% + 15% + 10% + 10% = 85%
So, where are the remaining 15%? The truth is, it’s unknown.
Previously, these 15% were allocated to so-called “Surveys,” conducted on platforms like strawpoll.com, where users were asked about their market outlook. However, the FGI team later decided to exclude survey results from the index calculation and did not disclose how they redistributed the freed-up 15% weight.
Let us assume these 15% were proportionally reallocated among the remaining metrics. This gives us the following adjusted weights:
- Volatility – 29%
- Momentum and trading activity – 29%
- Social sentiment – 18%
- Bitcoin dominance – 12%
- Search trend analysis – 12%
- Total: 29% + 29% + 18% + 12% + 12% = 100%
Retrospective Analysis of the Effectiveness of the Fear and Greed Index
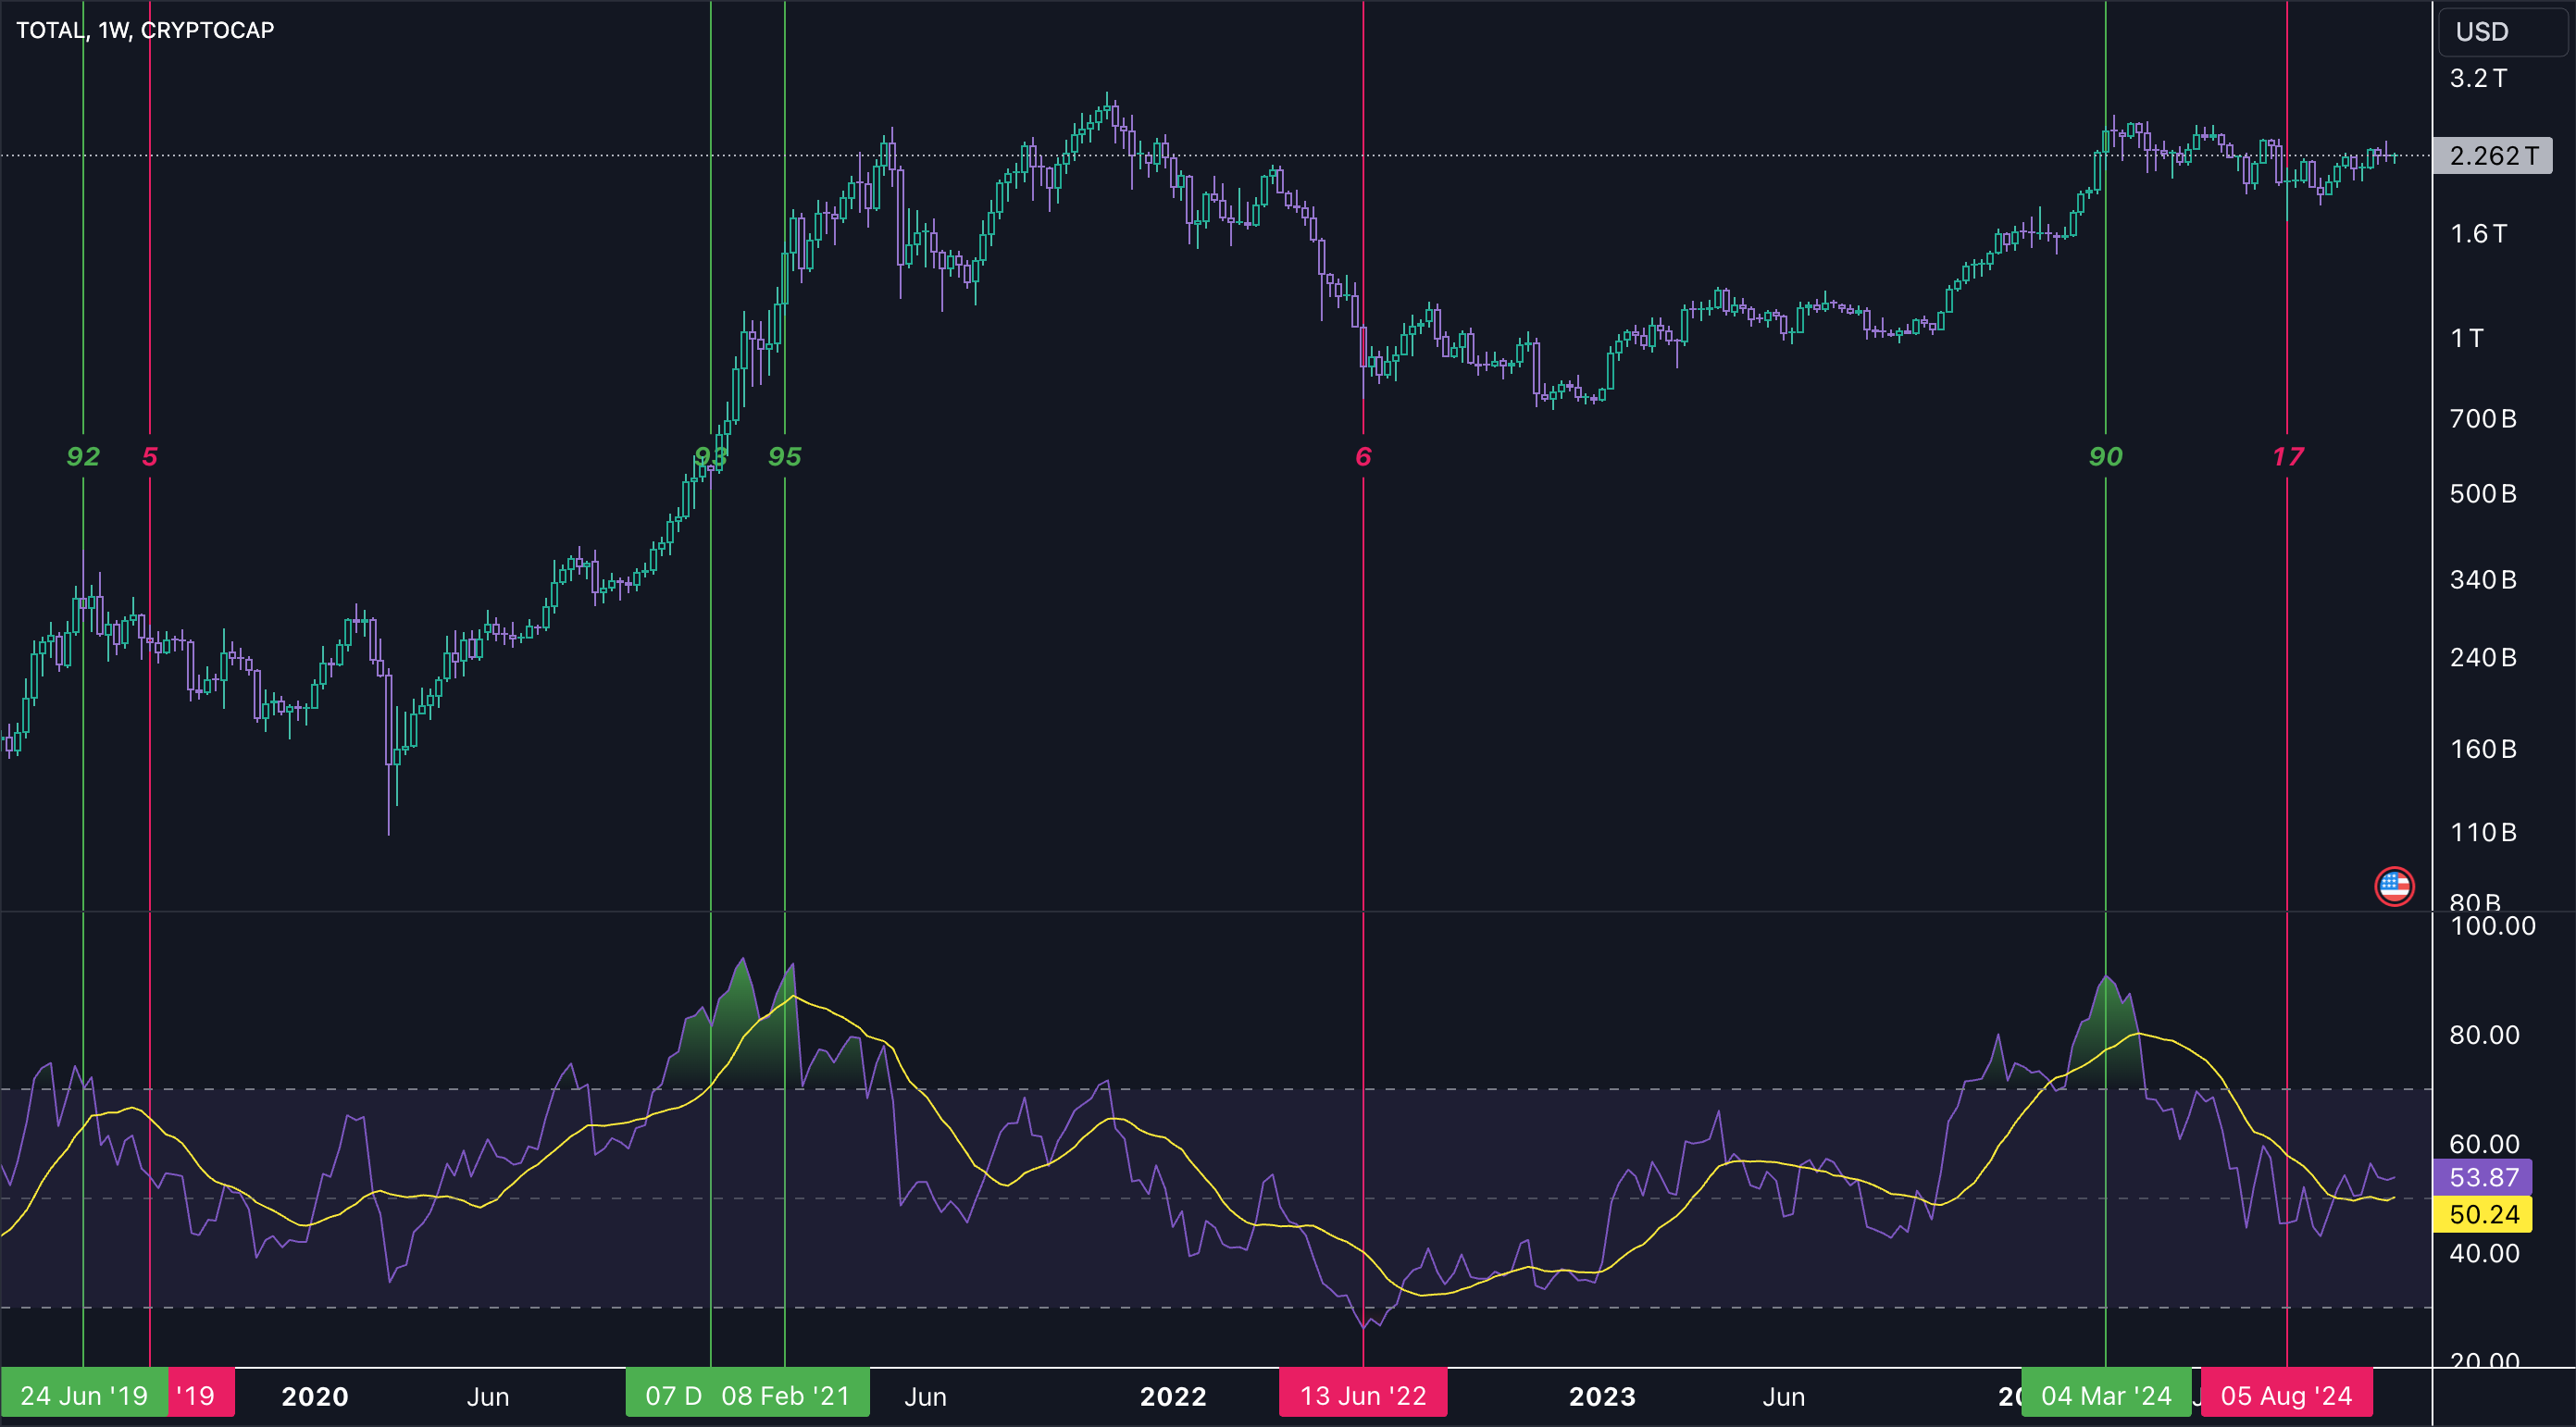
If you overlay the extreme FGI values on the chart of the total cryptocurrency market capitalization ($TOTAL), it becomes clear that it is far from being a precise indicator. It has almost never accurately identified the true market bottom or top and performs no better in this regard than another simple oscillator, the Relative Strength Index (RSI).
In the chart below, green vertical lines indicate FGI peaks (extreme greed), while red lines mark FGI lows (extreme fear). At the bottom of the chart, the RSI is displayed without any adjustments:

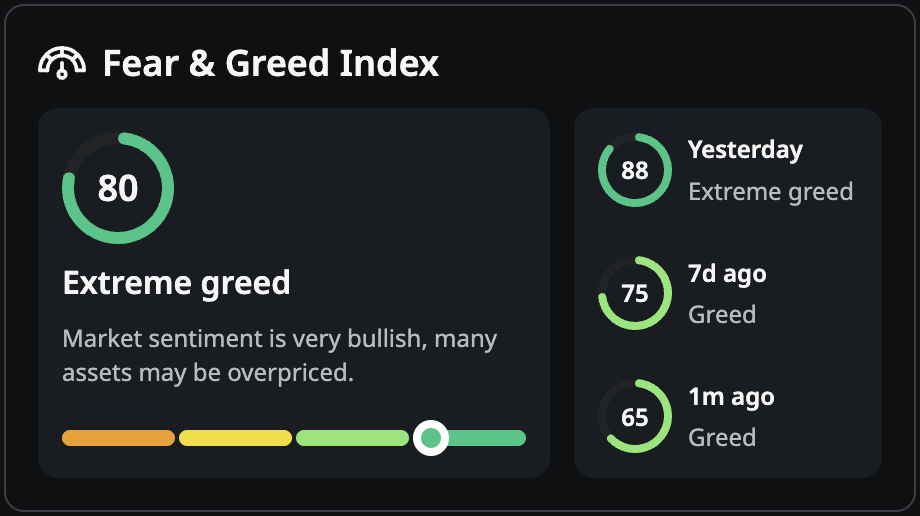
We can further visually assess the effectiveness of the indicator on our page by comparing the FGI bar chart with Bitcoin’s price. The chart uses the following color-coded zones: orange for extreme fear, yellow for fear, light green for greed, and dark green for extreme greed.

If you take a closer look, you’ll notice that the FGI performs fairly well at identifying near-bottom values (with the exception of summer-autumn 2022) but does a poor job at signaling market tops (aside from spring of this year). The period from the beginning to the end of 2021 is particularly striking. On both charts, it is evident that the FGI was too quick to signal extreme greed in the market.
In some sense, you could say that during a full-fledged bull market (the 4th year of the cycle), the FGI behaves like a clock that runs fast. This is likely caused by the fact that the first two metrics used in its calculation, which carry the most weight (58% combined), are based on average data from the past 30/90 days. Naturally, such a methodology cannot accurately capture a strong market trend, where each new month pushes prices higher than the previous one.
The issue lies in the fact that when the market enters a state of heightened speculative interest, it becomes extremely challenging to predict and pinpoint the turning point of such a trend. What appears to be a buying climax may be followed by even greater buying activity, as we are essentially trying to determine the limits of what is almost limitless: human greed. (In reality, what eventually runs out is not greed but money.)
Practical Recommendations for Using the Fear and Greed Index
Considering that we are approaching the final year of the cycle (you can read more about this in our article on the cyclical market structure) and the fact that the FGI’s accuracy tends to decrease significantly during this period, it is essential to use the index cautiously when making trading decisions. However, since the index functions as an oscillator, we can employ its readings in a clever and relatively safe way: by linking its values to the optimal proportion of our portfolio we are willing to risk. Let’s explore this with examples:
Imagine the current FGI value is 20 points. First, we calculate the inverse value of the index as follows: . Thus, with an FGI of 20, we can allocate 80% of our capital. Now, suppose a week later, the FGI rises to 25 points. The optimal share of the portfolio to risk would now be , meaning we should reduce our exposure by 5%. Conversely, if the index drops further, for instance, from 20 to 15 points, we would increase our holdings by 5%. If the FGI is 70 (as it was at the time of writing), the optimal proportion of allocated capital would be .
This approach is safe because, as mentioned earlier, the FGI has never reached its extreme values of 0 or 100 points. Consequently, following this strategy, we would never be fully invested in the market or completely out of it.
However, by adhering to this strategy, we risk missing out on significant profits during a bull market, as the FGI might remain in the 70–95 range throughout the year, limiting us to operating with only 5–30% of our capital. To increase risk with this approach, we can adjust the lower limit upwards. For example, we could set the minimum FGI value for being fully invested to 25 points. The higher we raise this minimum value, the more we shift our strategy along the risk-return curve.
In any case, the described strategy is merely food for thought and should not be considered financial advice.
To conclude the article, we’d like to note that financial markets are an excellent training ground for developing emotional control and mental resilience. We wish you success in navigating this journey without significant setbacks and achieving outstanding results!
Disclaimer: This post was independently created by the author(s) for general informational purposes and does not necessarily reflect the views of ChainRank Analytics OÜ. The author(s) may hold cryptocurrencies mentioned in this report. This post is not investment advice. Conduct your own research and consult an independent financial, tax, or legal advisor before making any investment decisions. The information here does not constitute an offer or solicitation to buy or sell any financial instrument or participate in any trading strategy. Past performance is no guarantee of future results. Without the prior written consent of CryptoRank, no part of this report may be copied, photocopied, reproduced or redistributed in any form or by any means.
Table of Contents
- Introduction
- How It Works
- What’s under the hood of the Fear and Greed Index?
- Volatility (25%)
- Market Impulse and Volumes (25%)
- Social Media (15%)
- Dominance (10%)
- Google Trends (10%)
- Retrospective Analysis of the Effectiveness of the Fear and Greed Index
- Practical Recommendations for Using the Fear and Greed Index