US debt surge puts TLT stock at risk amid rotation to BIL ETF

Compartir:
TLT (iShares 20+ Year Treasury ETF) slid to $86 (about 5% off this year’s high) with $4.49B of YTD outflows; technicals target $85 (50% Fib) then $84 (61.8%), signaling further downside. Macro/fiscal drivers: US public debt > $39T, China cut Treasuries to < $700B from > $1.2T, potential $200B–$1.5T defense spending and rising inflation (CPI 2.4% in Feb) lift Fed hike odds and push 30‑year yields ~5%, prompting rotation into short-term BIL (BIL added > $7B YTD). Market impact: higher yields and debt risk threaten long-duration assets and could siphon risk-on capital—negative for equities and risk assets including crypto, DeFi, token launches, DEX/CEX flows and fundraising.
Mercados de predicciones
Vea en qué se centran los traders

The iShares 20+ Year Treasury Bond ETF (TLT) remains under intense pressure this year as investors have remained concerned about the ballooning US government debt and rising long-term bond yields.
The TLT ETF stock dropped to $86, down by nearly 5% from its highest point this year.
Soaring US debt has pushed investors to BIL ETF
The TLT ETF is a top fund that tracks long-term government bonds.
This fund is sending a signal that US investors are worried about the US public debt, which has jumped to over $39 trillion.
The US public debt will keep growing because of the ongoing Iran war that is costing over $1 billion a day, a figure that will continue rising as the US considers ground forces in the country.
The Pentagon is considering a $200 billion war request, while President Donald Trump has urged Congress to pass a $1.5 trillion defence spending package.
At the same time, the Big Beautiful Bill is expected to cost the government trillions of dollars in the next decade, while the Supreme Court has ended Donald Trump’s tariffs that would have helped to offset the government spending.
Most importantly, China, which has been a buyer of US government bonds, has been selling its holdings.
It has moved its total holdings to below $700 billion from a record high of over $1.2 trillion in the past few years.
More countries, especially in Europe, the Middle East, and Asia, may continue selling their government bonds in the coming weeks or months.
European countries considered selling their US government bond holdings a few months ago when the Greenland crisis continued..
American investors are also selling long-term government bonds, which explains why the 30-year yield has jumped to nearly 5%.
Also, data shows that investors have also continued dumping their TLT ETF holdings.
They have dumped funds worth over $4.49 billion this year.
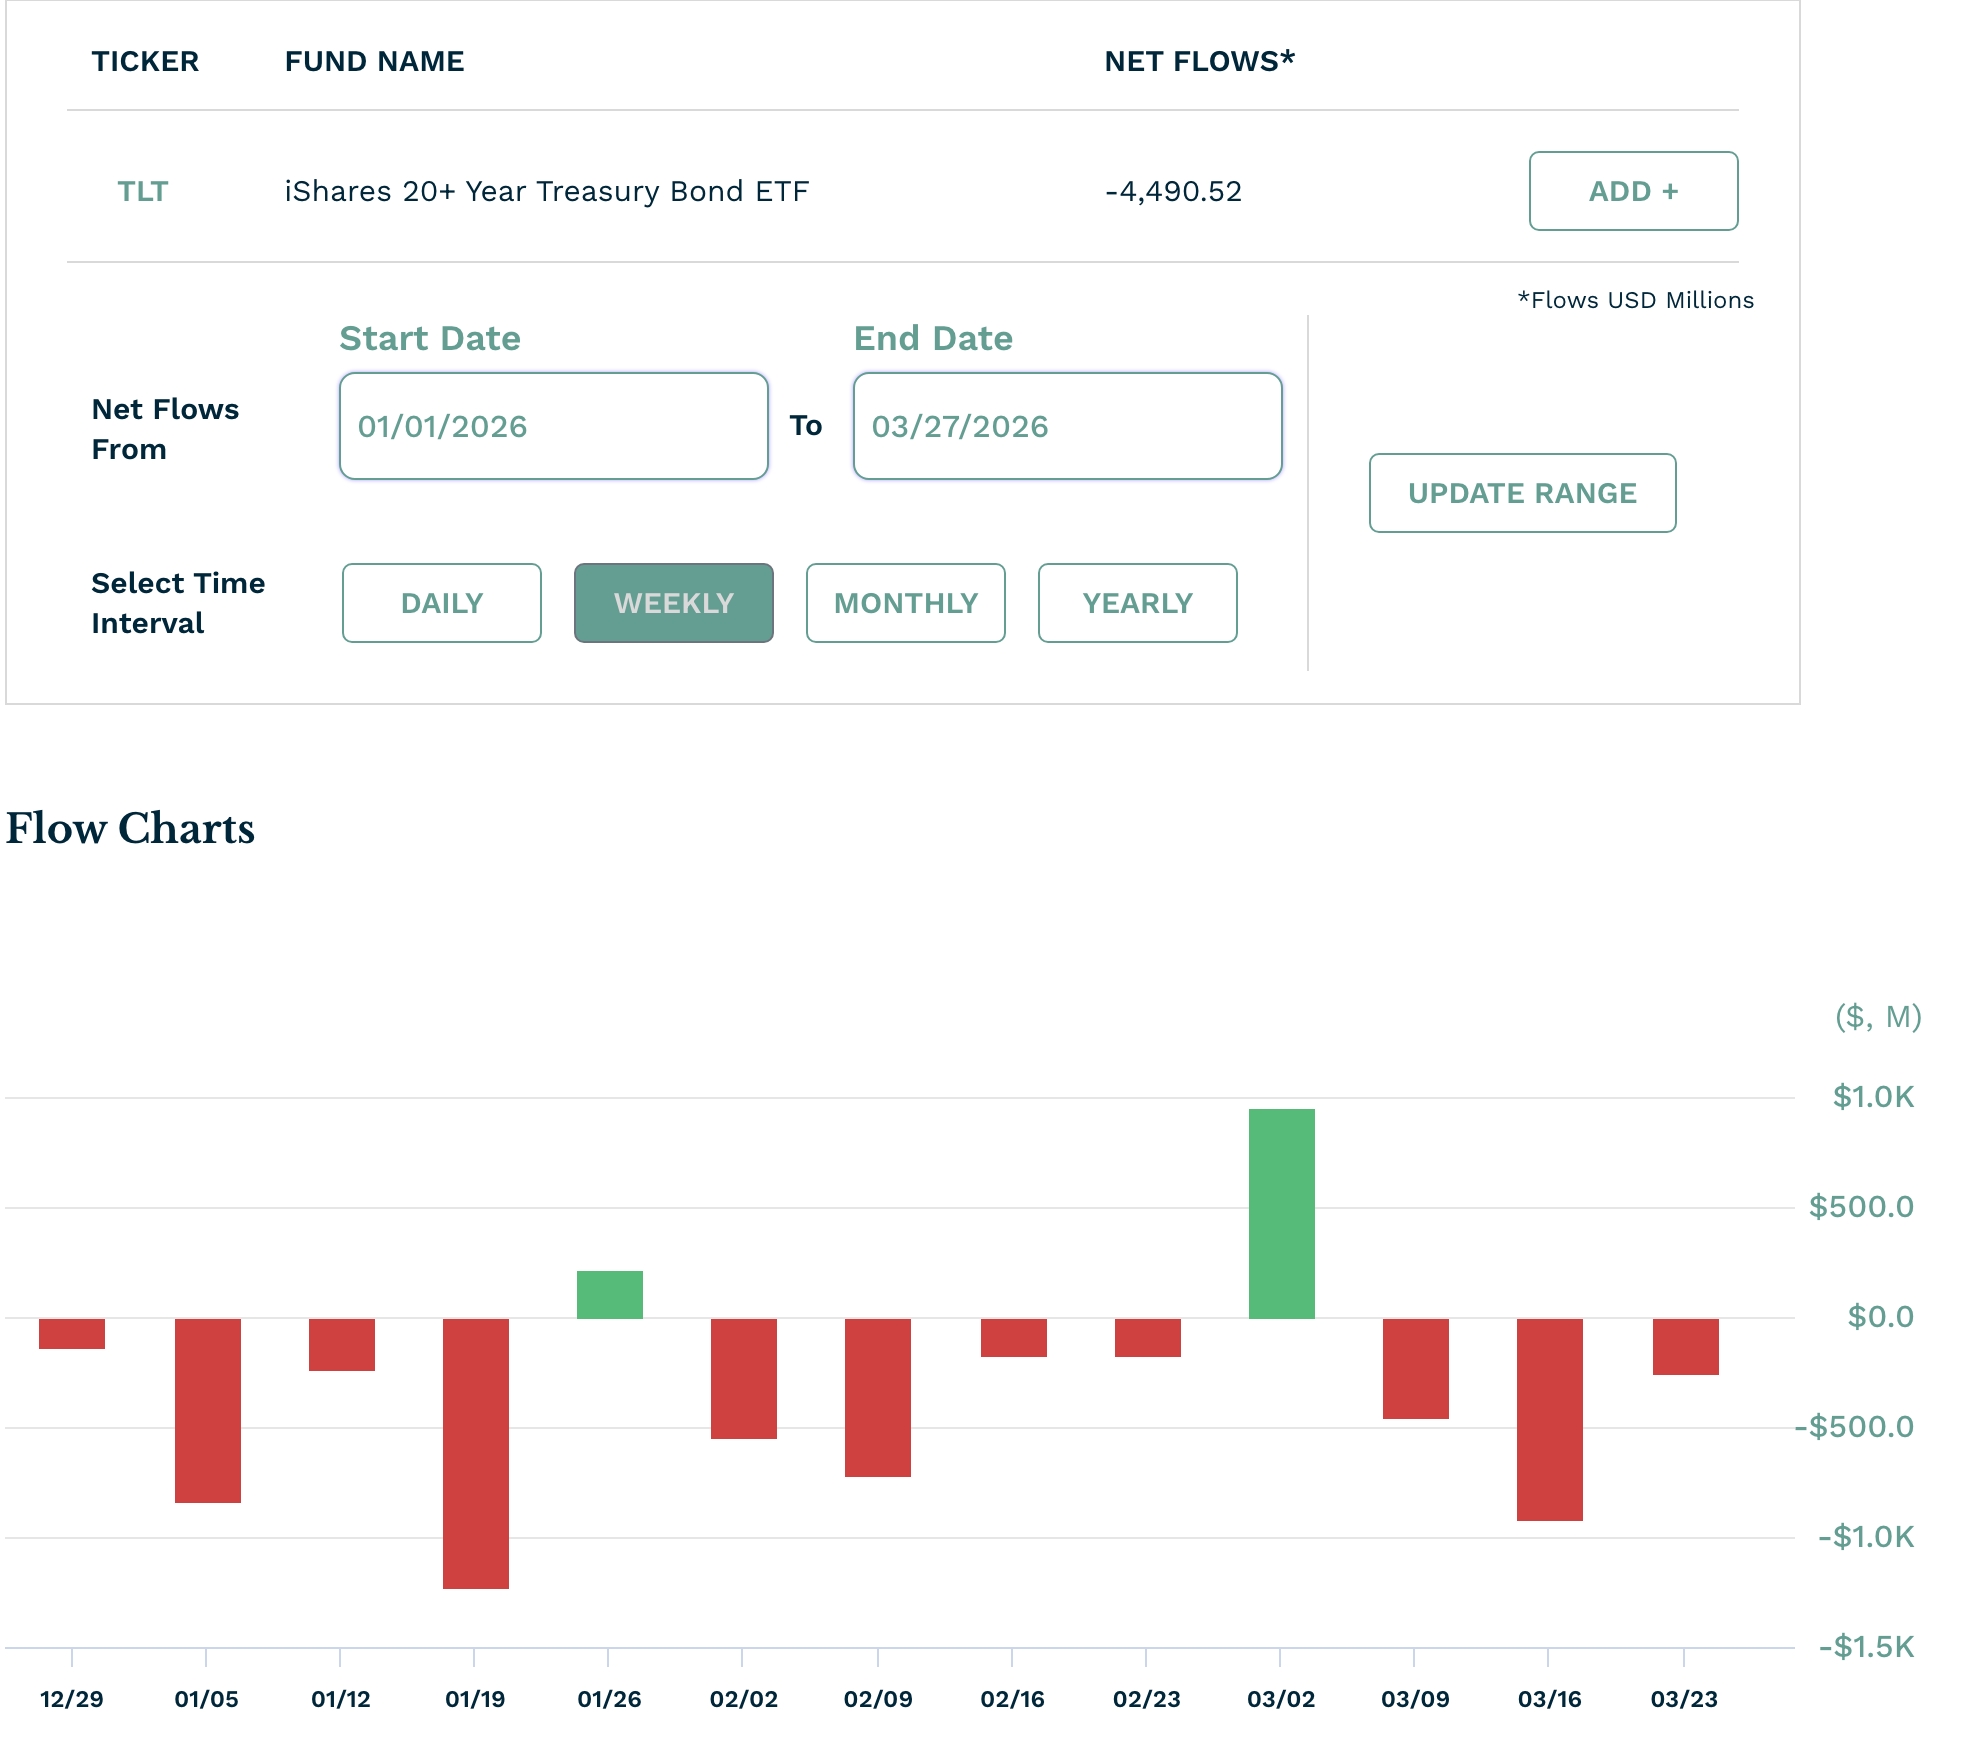
TLT ETF inflows and outflows | Source: ETF
On the other hand, short-term government bond yields have seen some more demand, with the State Street SPDR Bloomberg 1-3 Month T-Bill ETF (BIL) having added over $7 billion this year.
That is a sign that investors are rotating from long-term government bonds to short-term ones as the odds of a Federal Reserve interest rate hike have jumped amid the ongoing Iran war.
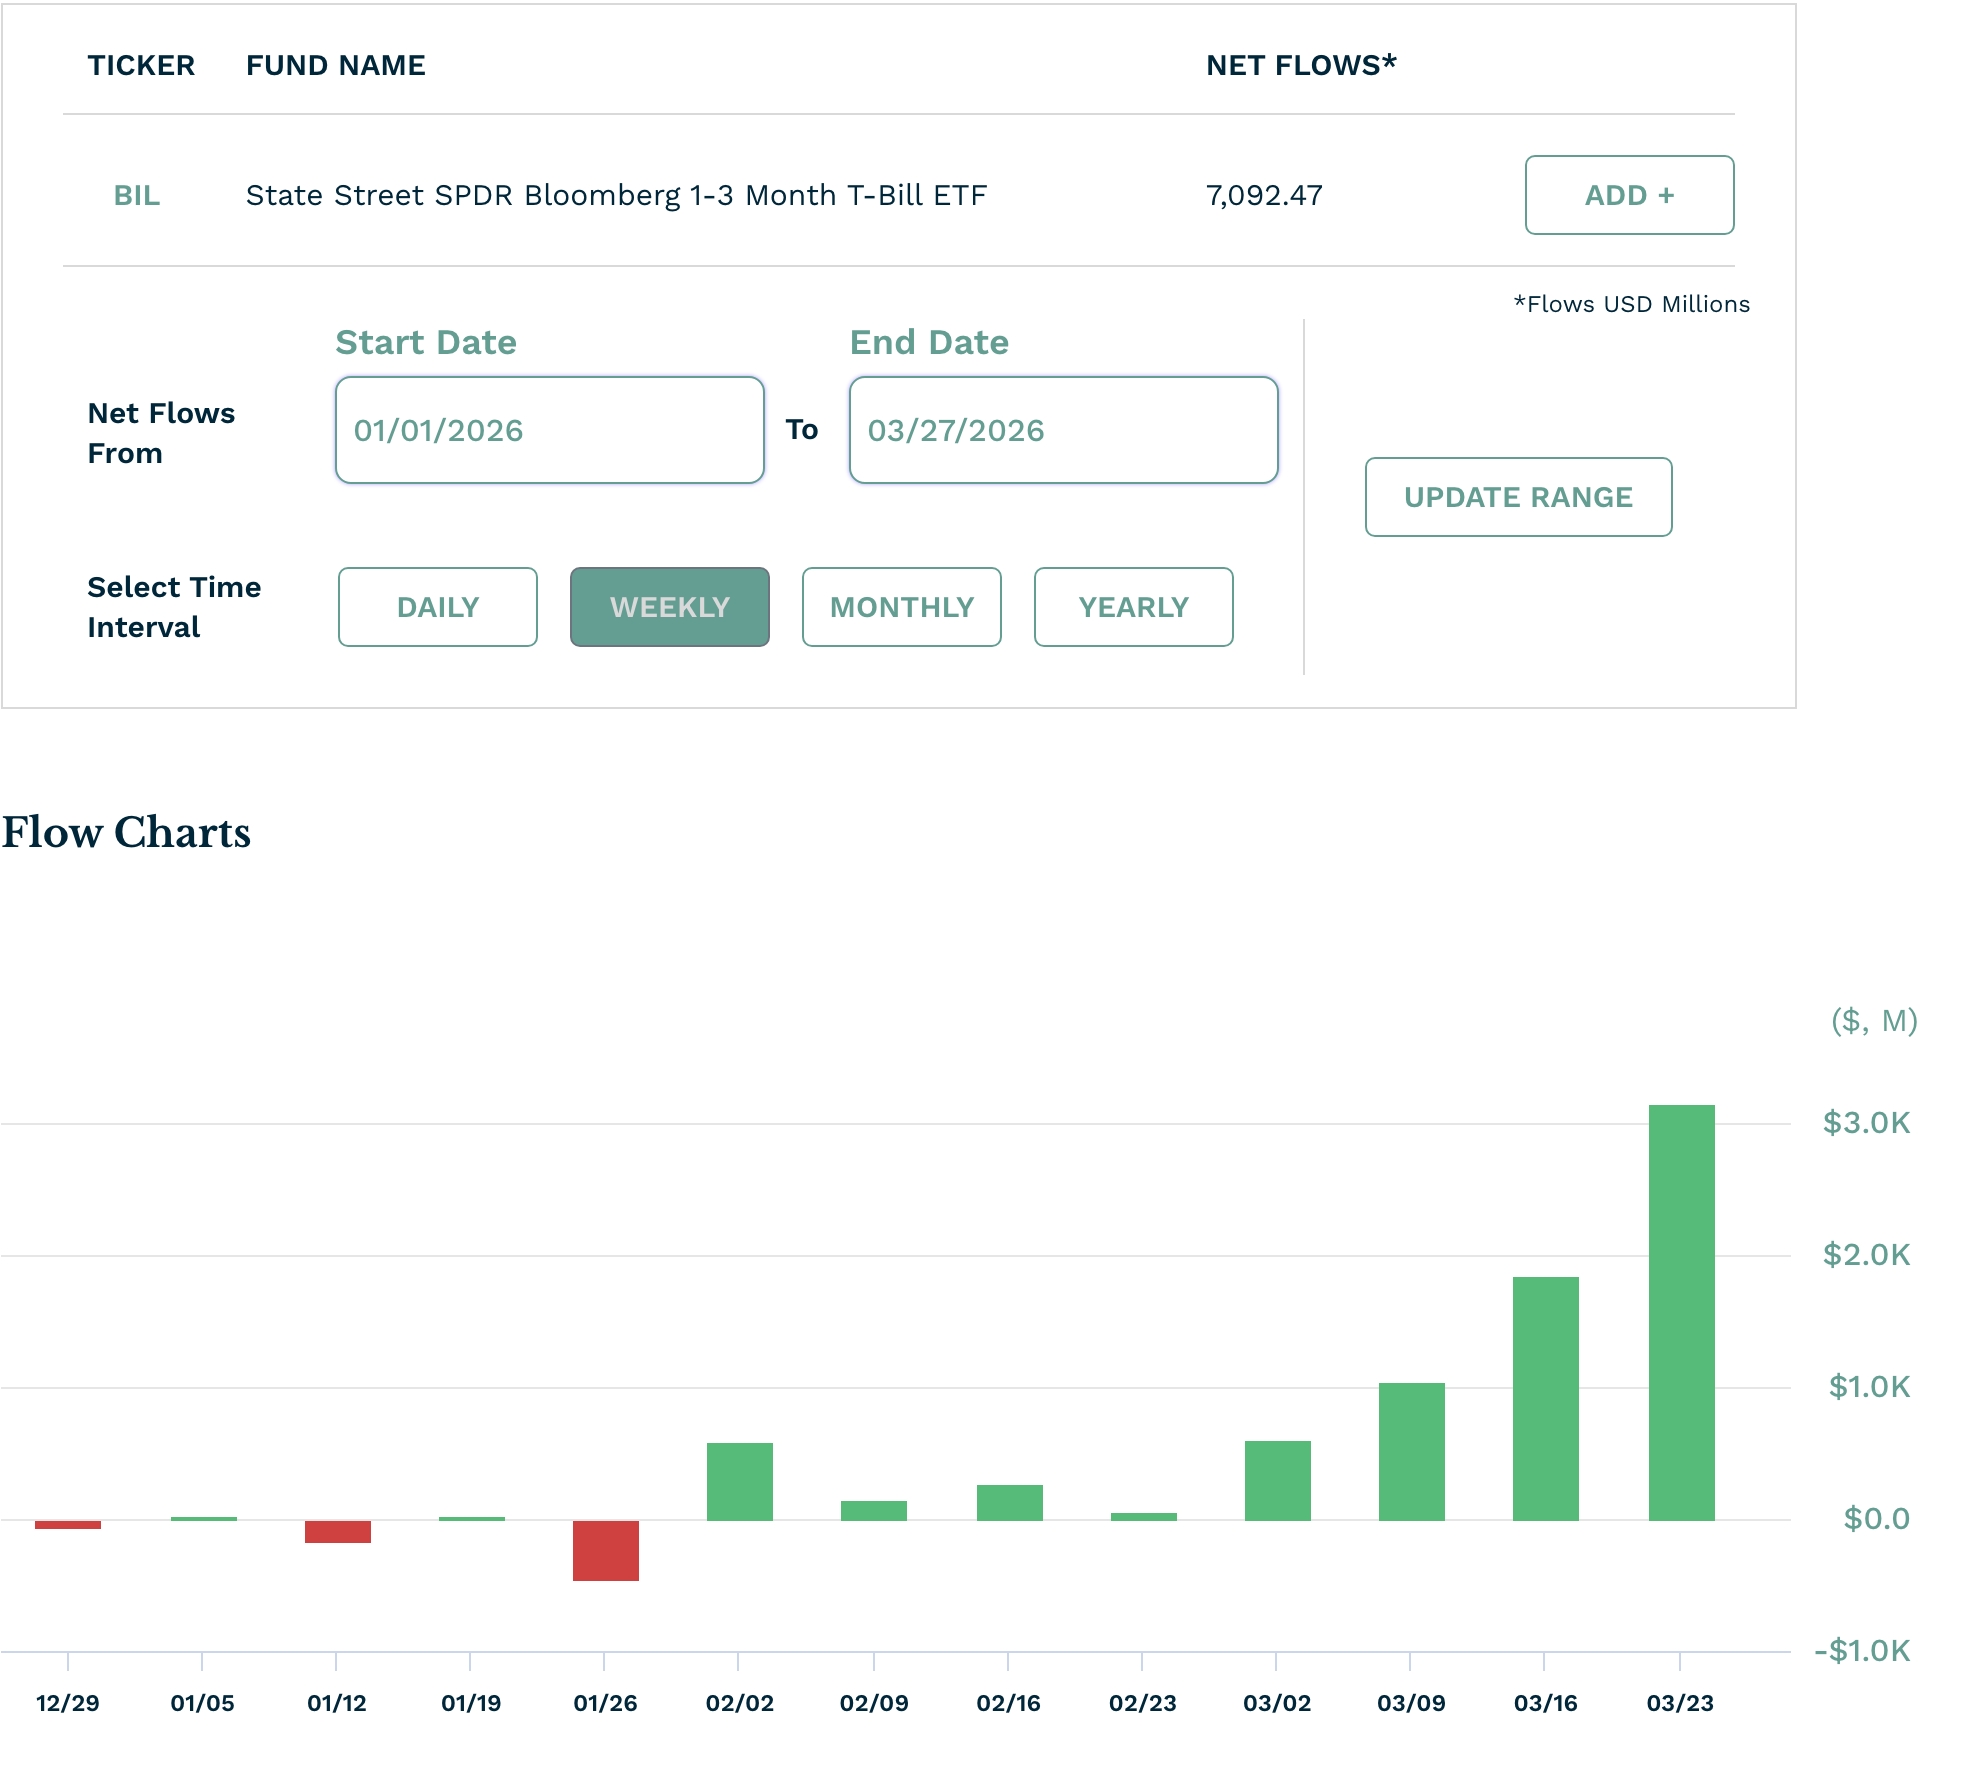
BIL ETF inflows | Source: ETF
Odds of a rate hike have continued rising amid the soaring inflation, which analysts expect will cross the important resistance level at 4% this year.
The most recent data showed that the headline Consumer Price Index (CPI) rose to 2.4% in February
TLT ETF stock price technical analysis
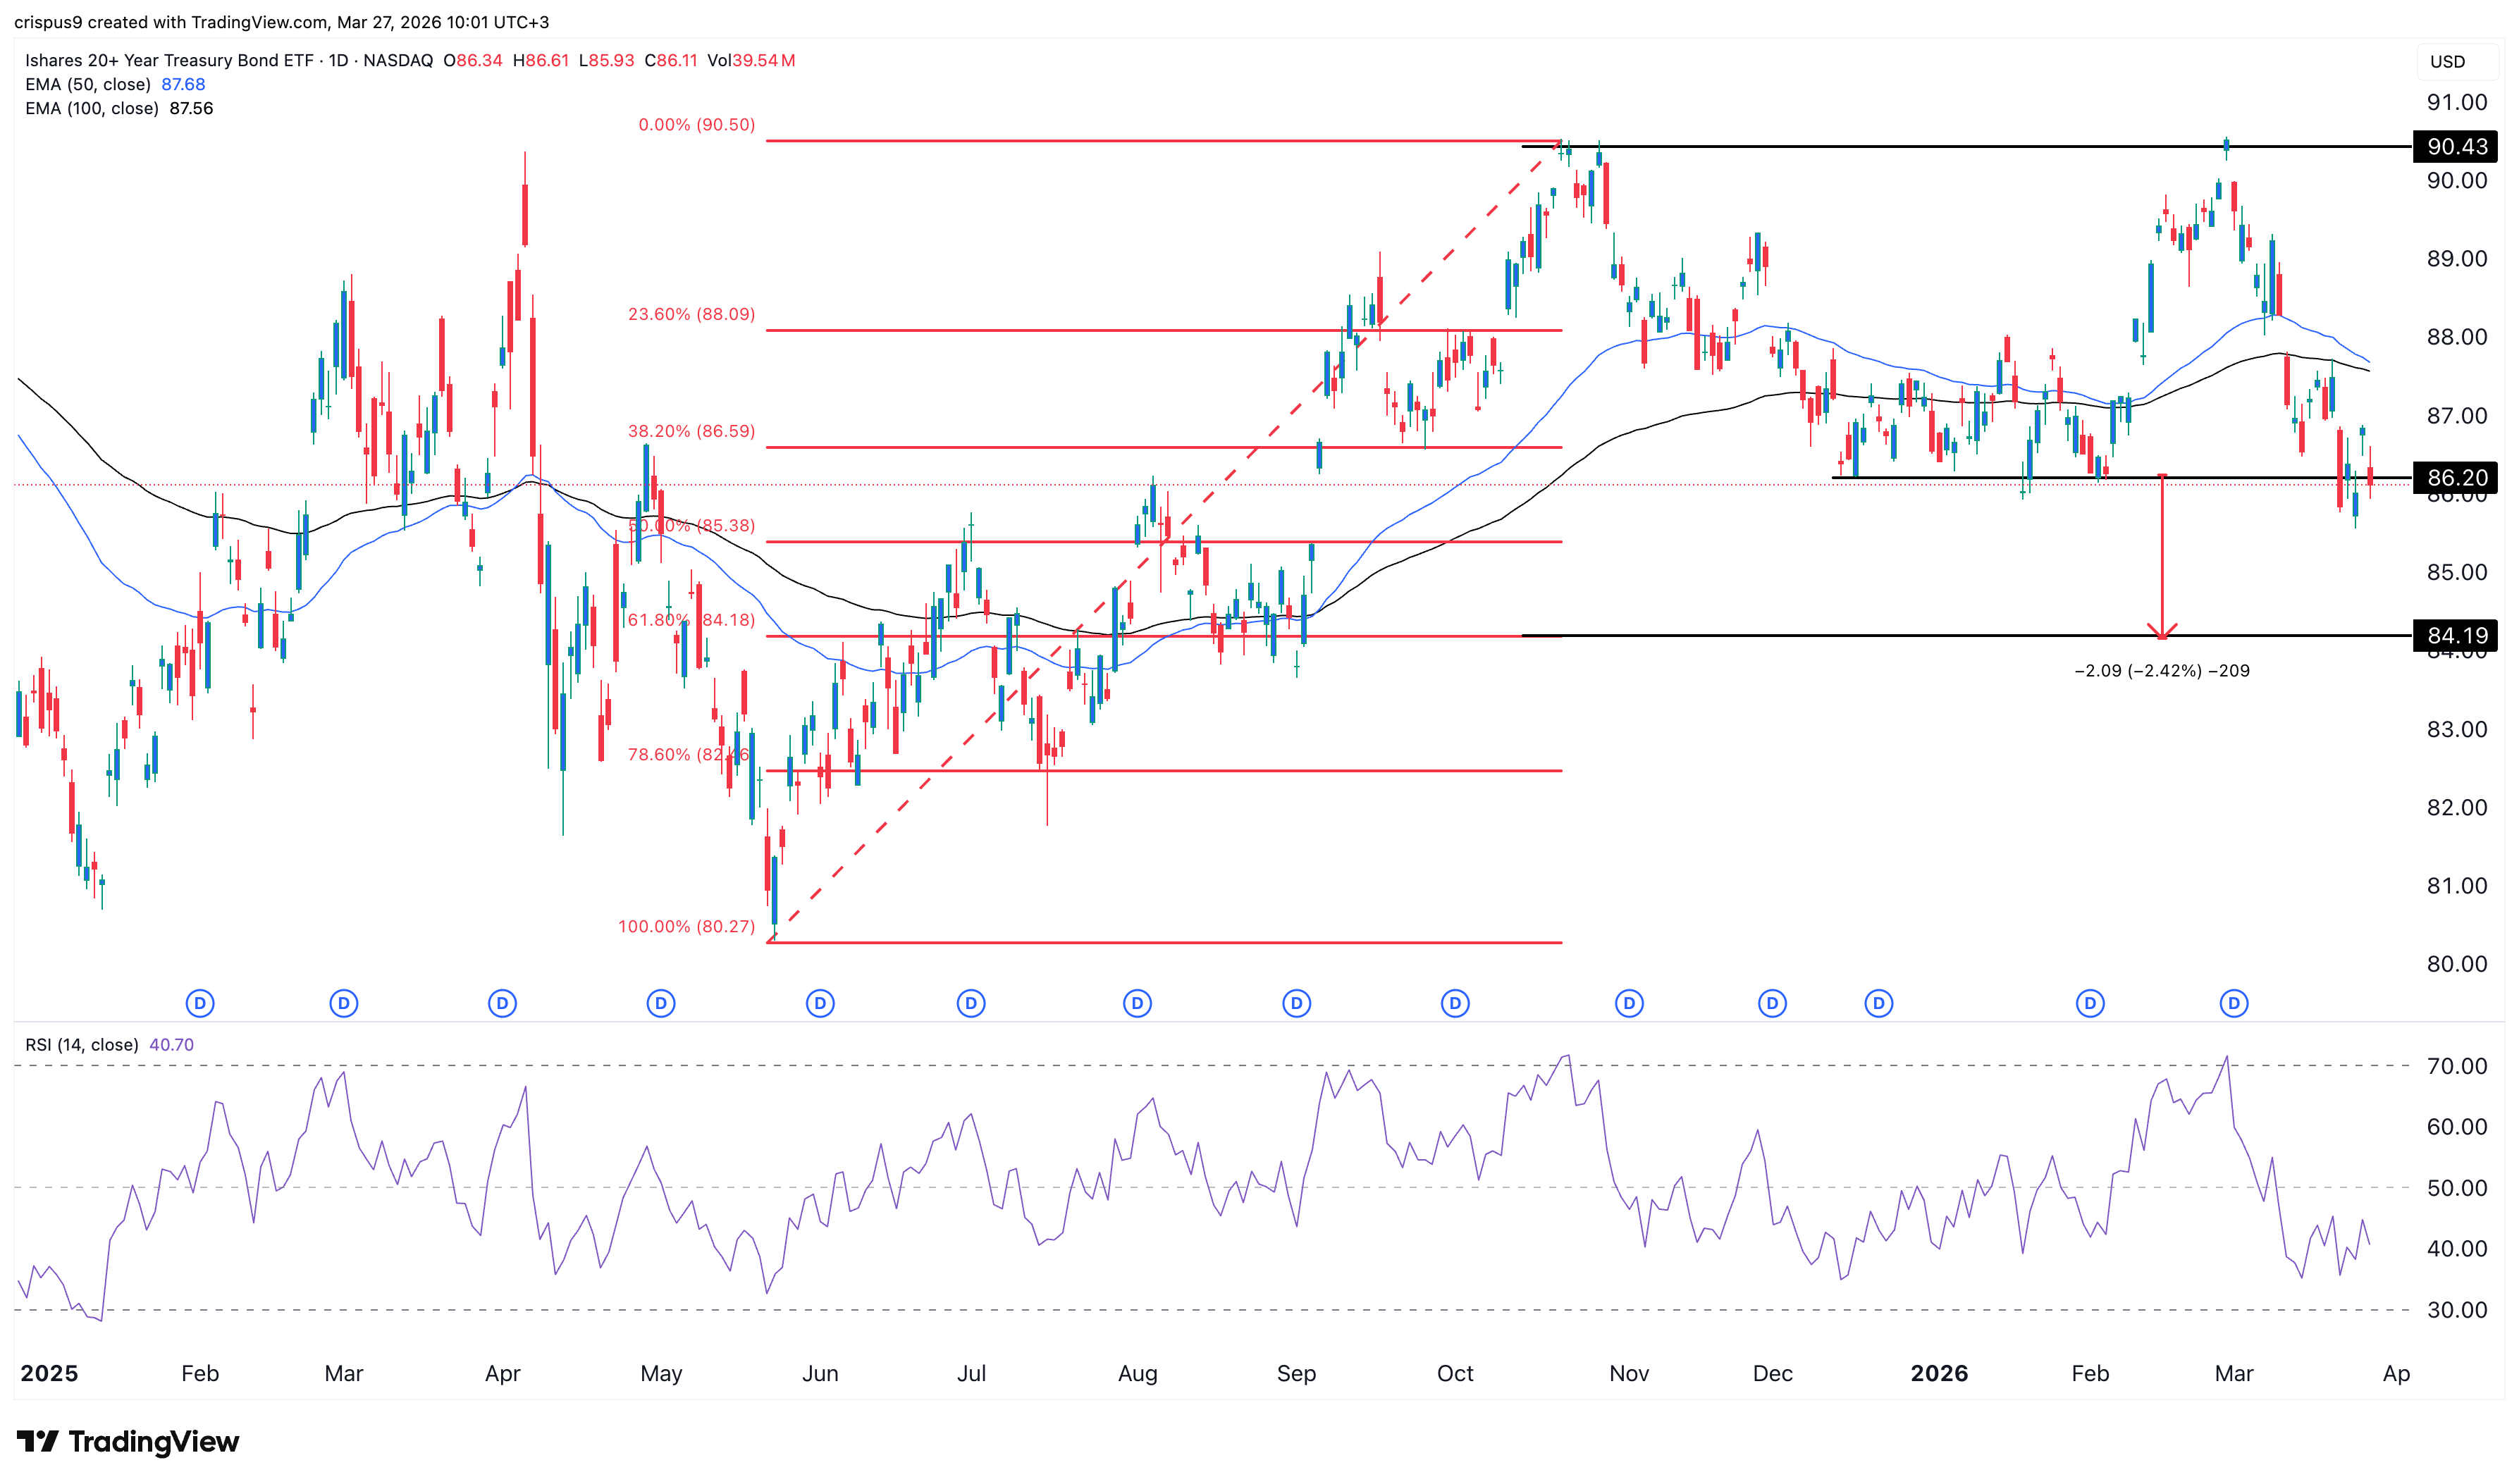
TLT share price chart | Source: TradingView
The daily timeframe chart shows that the TLT stock price has retreated in the past few weeks, moving from a high of $90.45 in February to the current $86.1.
It formed a giant double-top pattern at $90.45 and a neckline at $86.20, its lowest level in January this year.
The stock is about to form a mini death cross pattern, which happens when the 50-day and 100-day Exponential Moving Averages (EMA) are about to cross each other.
TLT has moved below the 38.2% Fibonacci Retracement level.
Therefore, the stock will likely continue falling, potentially to the next key target, being at the 50% Fibonacci Retracement level at $85.
A move below that level will point to more downside, potentially to the 61.8% retracement point at $84. This target is about 2.42% below the current level.
The post US debt surge puts TLT stock at risk amid rotation to BIL ETF appeared first on Invezz


Leer más

Crypto won the ETF fight but now the SEC is questioning if things have gone too far