Bitcoin Price Analysis: BTC Pushes Past $65K – Can It Keep Climbing?
Compartir:
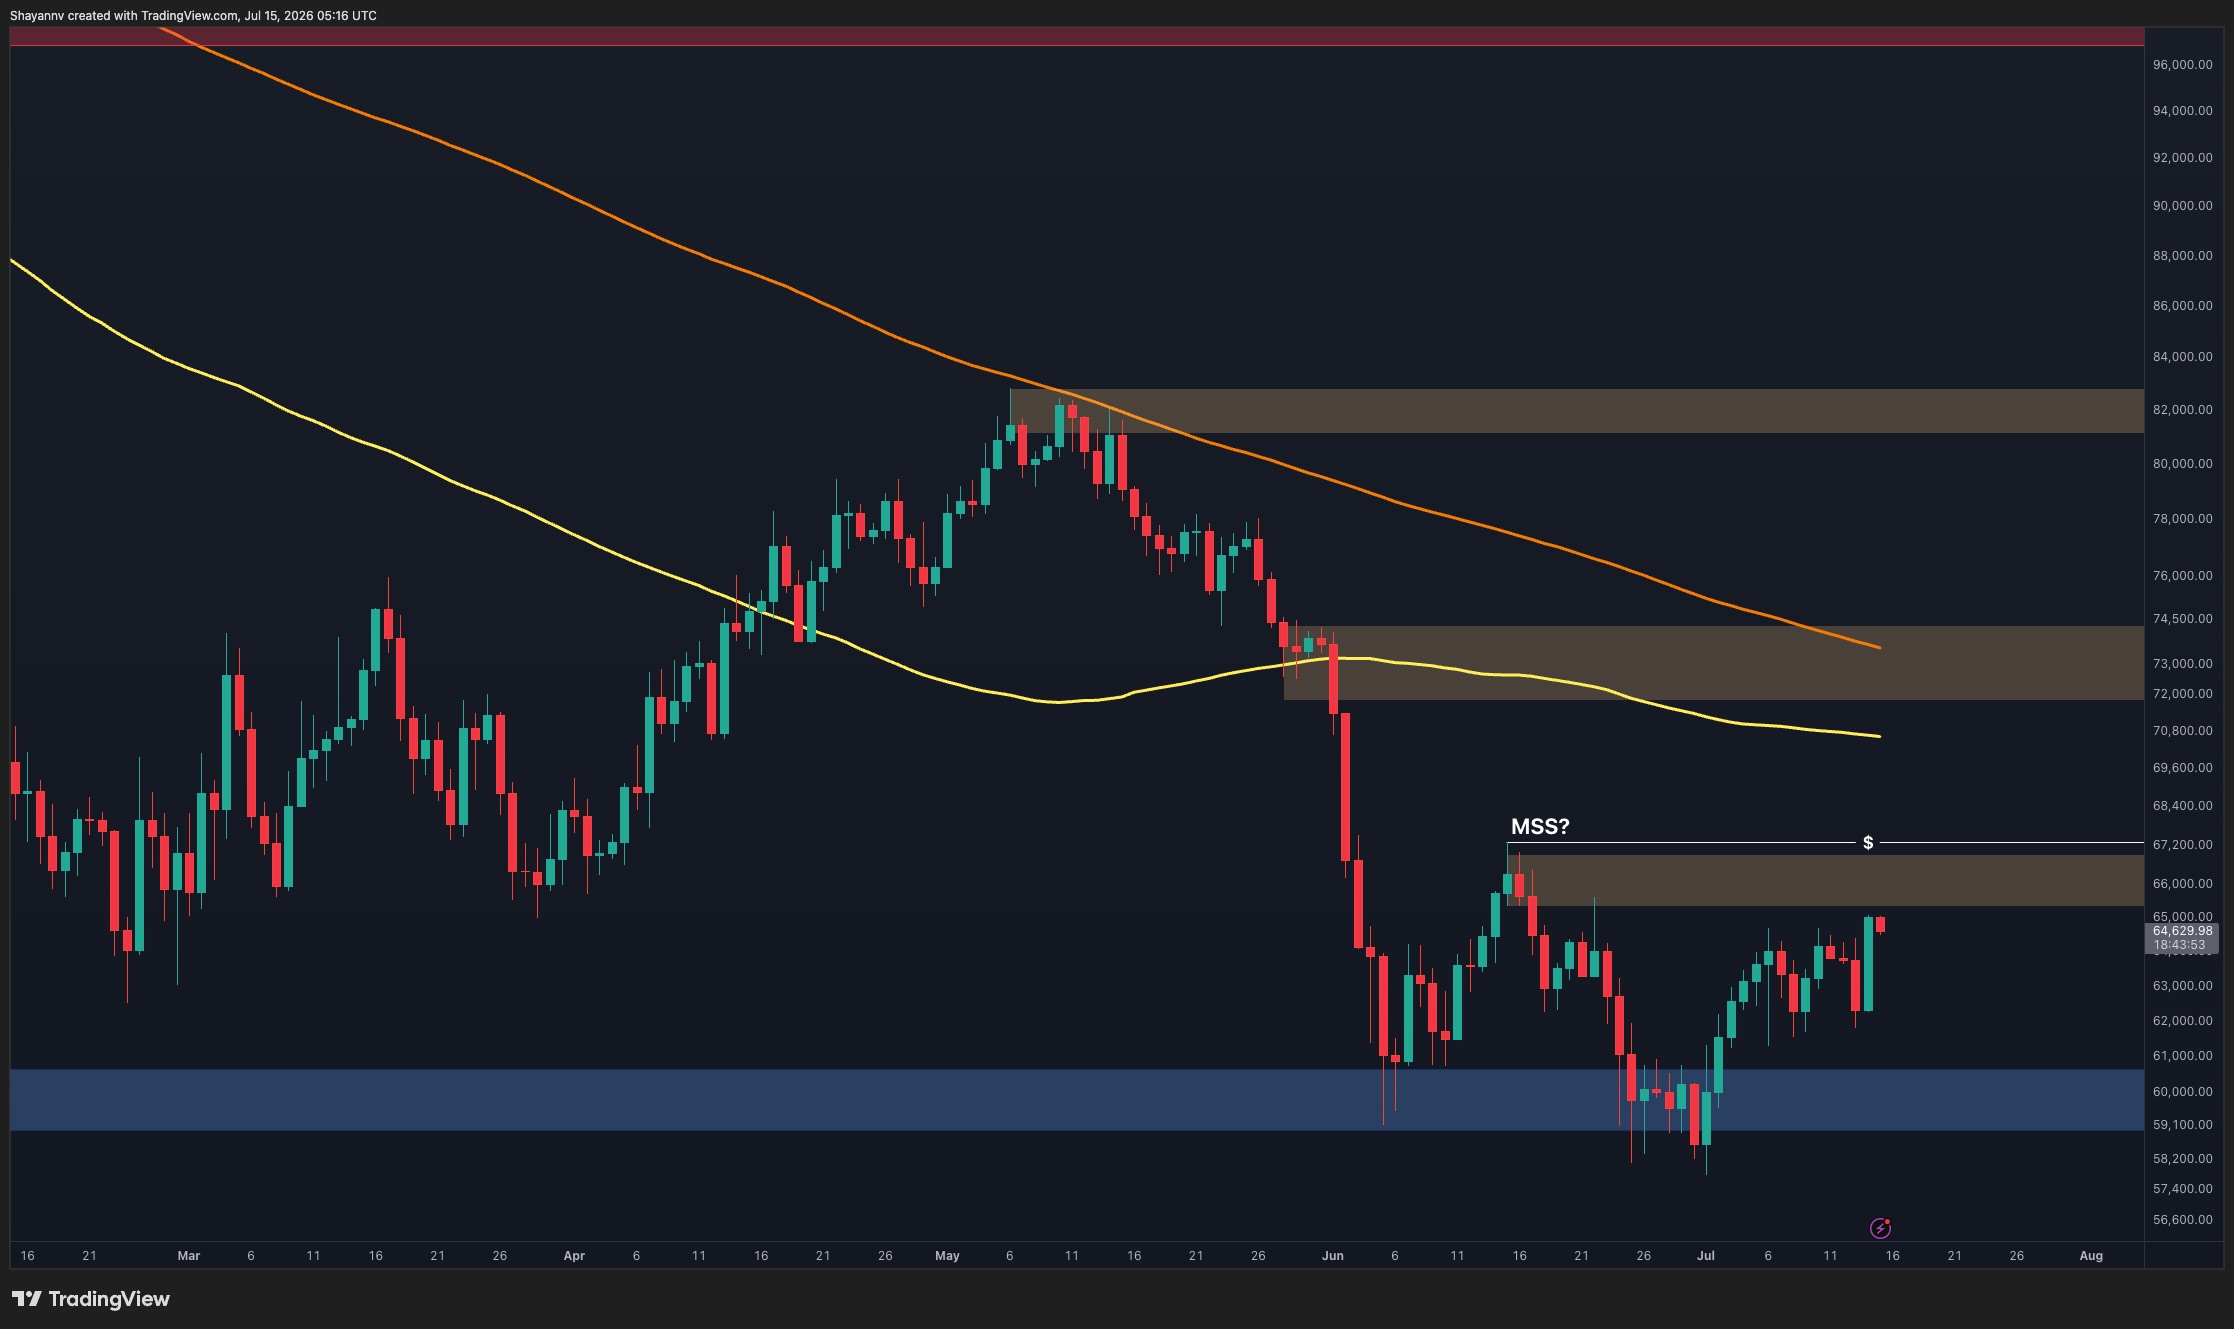
Bitcoin has reclaimed several short-term resistances and recovered from the $58K-$60K support zone, but it remains below the 100-day and 200-day moving averages which continue to slope downward. The rally is now testing a critical supply area at $65K-$67K, a technical decision point that will determine whether this crypto move becomes a broader trend reversal or remains a relief rally within the larger bearish market.
Mercados de predicciones
Vea en qué se centran los traders

Bitcoin’s notable rally is now approaching a major technical decision point. The asset has reclaimed several short-term resistance levels and is once again testing a critical supply area that could determine whether the current recovery evolves into a broader trend reversal or remains a relief rally within the larger bearish structure.
Bitcoin Price Analysis: The Daily Chart
On the daily timeframe, Bitcoin remains below both the 100-day and 200-day moving averages, which continue to slope downward and reinforce the broader bearish trend. The recent recovery from the $58K-$60K support zone has been impressive, but the price is now approaching the first significant supply region around $65K-$67K.
En esta nota
Criptomonedas

$ 63.20K
-2.25%
$ 0.00184
Mercados de predicciones
Vea en qué se centran los traders
Compartir:
En esta nota
Criptomonedas
$ 63.20K
-2.25%$ 0.00184
Mercados de predicciones
Vea en qué se centran los traders
Compartir:
Leer más
Bitcoin Price Analysis: Is BTC Headed Below $60K After $65.5K Rejection?