Ethereum Price Holds $2,370 While Leverage Raises Pullback Risk

Compartir:
On Aug. 21, 2026 Ethereum held above $2,370 after a sharp rally, trading around $2,334-$2,376 with a 3.02% daily gain, a 23.82% seven-day advance and market cap near $283.06 billion while 24-hour spot volume was $5.07B versus $74.22B in futures. Elevated leverage and volatility—one-month vol ~48.27%, open interest ~$30.6B and $184.19M in 24-hour liquidations—plus tightly clustered EMAs and resistance near $2,396 vs support at $2,367 raise pullback risk ahead of the Glamsterdam H2 2026 milestone, signaling caution for crypto traders, DeFi desks and derivatives markets.
Mercados de predicciones
Vea en qué se centran los traders


Key Insights:
- Ethereum price held above $2,370 as leveraged positioning expanded.
- ETH futures activity remained far larger than spot trading volume.
- Resistance near $2,396 could determine the next short-term move.
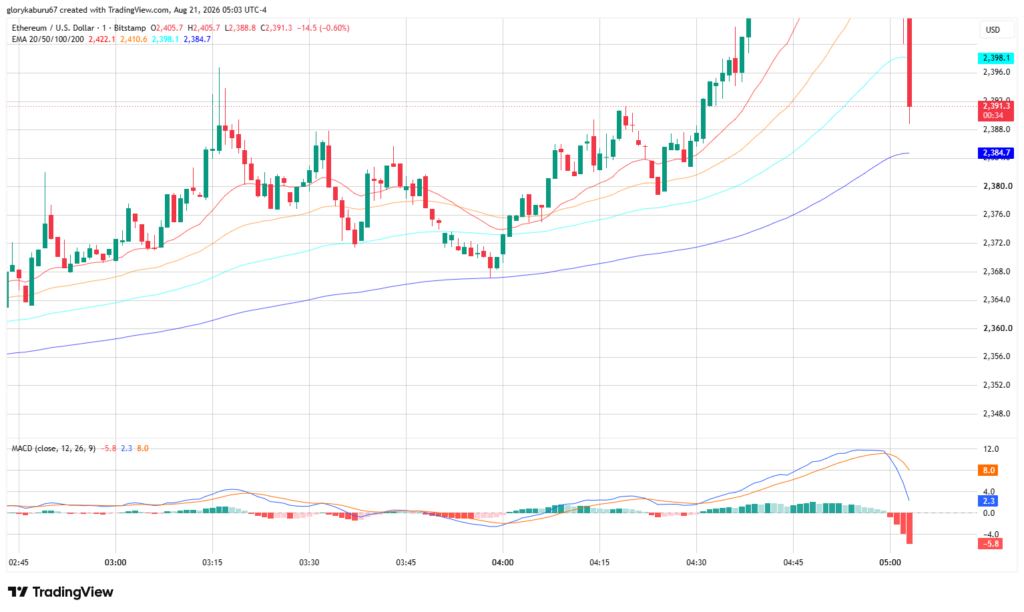
Ethereum price held above $2,370 on Aug. 21 after a sharp rally cleared prior resistance. TradingView’s one-minute ETH/USD chart showed $2,376.1 at 04:04 UTC-4. The move kept momentum positive, while leverage data pointed to growing liquidation risk.
The advance mattered because derivatives activity expanded much faster than spot turnover. That imbalance left ETH exposed to sharper intraday swings if leveraged traders exited together. Ethereum’s broader network roadmap offered no immediate market catalyst during the session.
Ethereum Price Holds Gains as Trading Activity Accelerates
CoinGlass data showed ETH trading near $2,334 during the Aug. 21, 2026, session. The platform measured a 3.02% daily gain and a 23.82% seven-day advance, and Ethereum’s market capitalization was near $283.06 billion.
CoinGlass recorded $5.07 billion in 24-hour spot volume. Futures turnover reached $74.22 billion during the same period. That gap showed derivatives traders dominated short-term activity around the latest price move.
CoinGecko historical data showed ETH closed at $1,877.74 on Aug. 12. The later move above $2,300 therefore followed a rapid repricing from mid-August levels. The TradingView ETH chart showed buyers briefly pushing ETH toward $2,396 before the market retraced.
Ethereum Foundation records showed no new protocol upgrade launched during the Aug. 21 session. The official roadmap still lists Glamsterdam for the second half of 2026. That timing suggested the immediate price move came from positioning rather than a same-day network upgrade.
Ethereum Price Structure Keeps Bulls Above Key Averages
The TradingView chart placed ETH above all four displayed exponential moving averages. The 20-period average stood near $2,374.8, while the 50-period average sat around $2,375.7. The 100-period and 200-period averages were near $2,373.5 and $2,367.6.
That configuration kept the intraday structure constructive, but the averages remained tightly clustered. Such compression reduced the distance between support and failure levels. A break below the cluster could quickly weaken the latest rebound.
The Moving Average Convergence Divergence also improved near the chart’s right edge. Its histogram turned positive at 0.7 after several negative readings. The MACD line, however, remained below zero, limiting confirmation from momentum.
New York University’s Volatility Lab had already recorded elevated Ethereum volatility before the breakout. Its Aug. 14 model estimated one-month volatility at 48.27%. The measure had risen 6.98% from the previous observation.
That backdrop supported caution around short-term directional trades. Higher volatility can widen intraday ranges without confirming trend continuation. The current chart, therefore, favored momentum, but not a low-risk entry.
Ethereum Price Faces Leverage Risk After Short Liquidations
CoinGlass measured Ethereum open interest near $30.60 billion during the session. The platform also reported about $184.19 million in 24-hour ETH futures liquidations. Those figures showed leverage remained elevated after the rally.
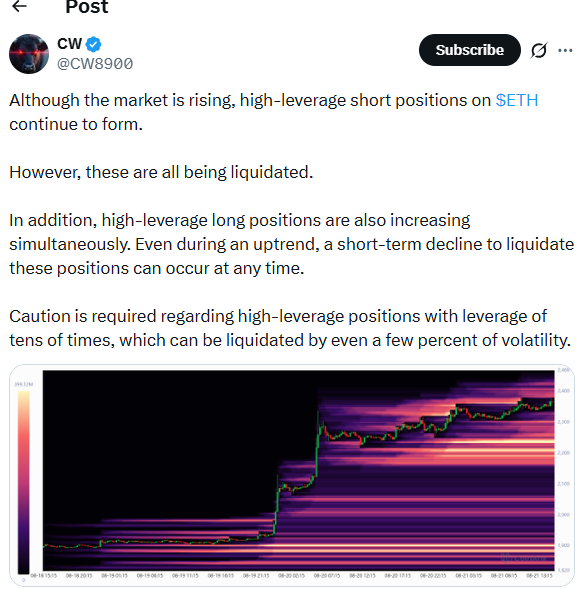
Crypto analyst CW posted on X that high-leverage short positions continued forming during the advance. The trader also observed a rise in leveraged long positions. That combination increased exposure on both sides if volatility accelerated.
Rain, another market analyst, said ETH had cleared the $1,980 to $2,000 resistance area. The analyst described $2,000 as the next level requiring support confirmation. That zone sat well below the current market, leaving room for a deeper retracement.
Crypto Tony identified the recent range high as the next upside area to test. TradingView’s chart placed immediate resistance around $2,388 to $2,396. A clean break there would extend the intraday recovery structure.
Ethereum Watches $2,367 Support and $2,396 Resistance
The nearest support sat around the 200-period exponential moving average at $2,367.6. TradingView’s chart also showed repeated trading around $2,374 to $2,376. Losing that cluster would expose the earlier intraday lows near $2,360.
Resistance remained concentrated near the session’s upper wick around $2,396. The broader $2,400 area would become the next visible test above that level. Traders also faced elevated derivatives positioning before any confirmed continuation.
Ethereum’s next protocol milestone remained Glamsterdam, scheduled for the second half of 2026. Until then, the price of Ethereum depended more directly on liquidity, leverage, and broader crypto flows. The next technical decision centered on $2,367 support versus $2,396 resistance.
The post Ethereum Price Holds $2,370 While Leverage Raises Pullback Risk appeared first on The Coin Republic.
En esta nota
Criptomonedas


Mercados de predicciones
Vea en qué se centran los traders
Compartir:
En esta nota
Criptomonedas
Mercados de predicciones
Vea en qué se centran los traders
Compartir:
Leer más

Crypto Market Faces Further Correction Risk as Downside Liquidity Builds, Analyst Warns