Shiba Inu Forms a Descending Triangle, But Key Indicators Are Flashing Bullish

- SHIB forms descending triangle with support at $0.00001200 and breakout target $0.00001600.
- RSI at 51.59 and MACD crossover signal mild bullish momentum for SHIB price action.
- Futures open interest stabilizes at $100M–$200M, showing reduced speculative excess.
Shiba Inu (SHIB) is showing a bearish structure on its daily chart, with technical indicators signaling a possible breakout in the near term. The token, which recently posted small gains, remains bound within support and resistance levels as traders weigh the next directional move.
The SHIB/USDT pair on Binance has formed a descending triangle pattern, with resistance marked by a downward-sloping trendline and support holding near $0.00001200. This boundary has been tested repeatedly, with buyers holding onto the lower level and sellers capping rallies.
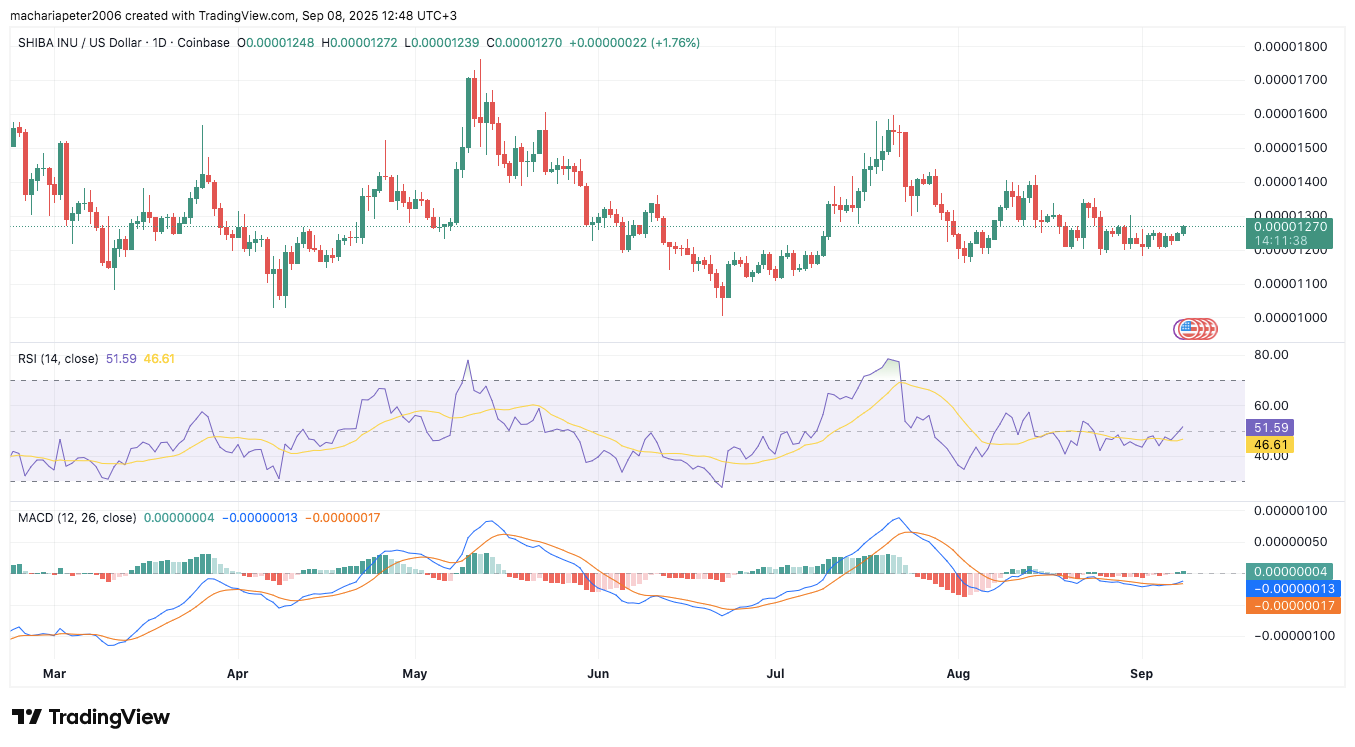
The price action within this formation shows an imminent decision point. Chart projections indicate that a confirmed breakout above resistance could produce an estimated 34% move, targeting $0.00001600. This projection aligns with the height of the triangle, a method often used in technical analysis.
At press time, SHIB was trading at…
The post Shiba Inu Forms a Descending Triangle, But Key Indicators Are Flashing Bullish appeared first on Coin Edition.
Читать больше

Shiba Inu Breakout Puts $0.000018 in Sight as Traders Test Key Resistance

Shiba Inu Forms a Descending Triangle, But Key Indicators Are Flashing Bullish
- SHIB forms descending triangle with support at $0.00001200 and breakout target $0.00001600.
- RSI at 51.59 and MACD crossover signal mild bullish momentum for SHIB price action.
- Futures open interest stabilizes at $100M–$200M, showing reduced speculative excess.
Shiba Inu (SHIB) is showing a bearish structure on its daily chart, with technical indicators signaling a possible breakout in the near term. The token, which recently posted small gains, remains bound within support and resistance levels as traders weigh the next directional move.
The SHIB/USDT pair on Binance has formed a descending triangle pattern, with resistance marked by a downward-sloping trendline and support holding near $0.00001200. This boundary has been tested repeatedly, with buyers holding onto the lower level and sellers capping rallies.
The price action within this formation shows an imminent decision point. Chart projections indicate that a confirmed breakout above resistance could produce an estimated 34% move, targeting $0.00001600. This projection aligns with the height of the triangle, a method often used in technical analysis.
At press time, SHIB was trading at…
The post Shiba Inu Forms a Descending Triangle, But Key Indicators Are Flashing Bullish appeared first on Coin Edition.
Читать больше