Tezos (XTZ) Price Prediction for July 20, 2025: XTZ Breaks Downtrend With 21% Weekly Rally


Tezos price has broken above its long-standing descending trendline for the first time in nearly seven months. The breakout, backed by strong volume and bullish indicator alignment, comes after XTZ rallied over 21% this week. As of writing, Tezos price today stands at $0.776, testing the 0.236 Fibonacci retracement level and eyeing the $0.82–$0.85 zone as its next challenge.
What’s Happening With Tezos’ Price?
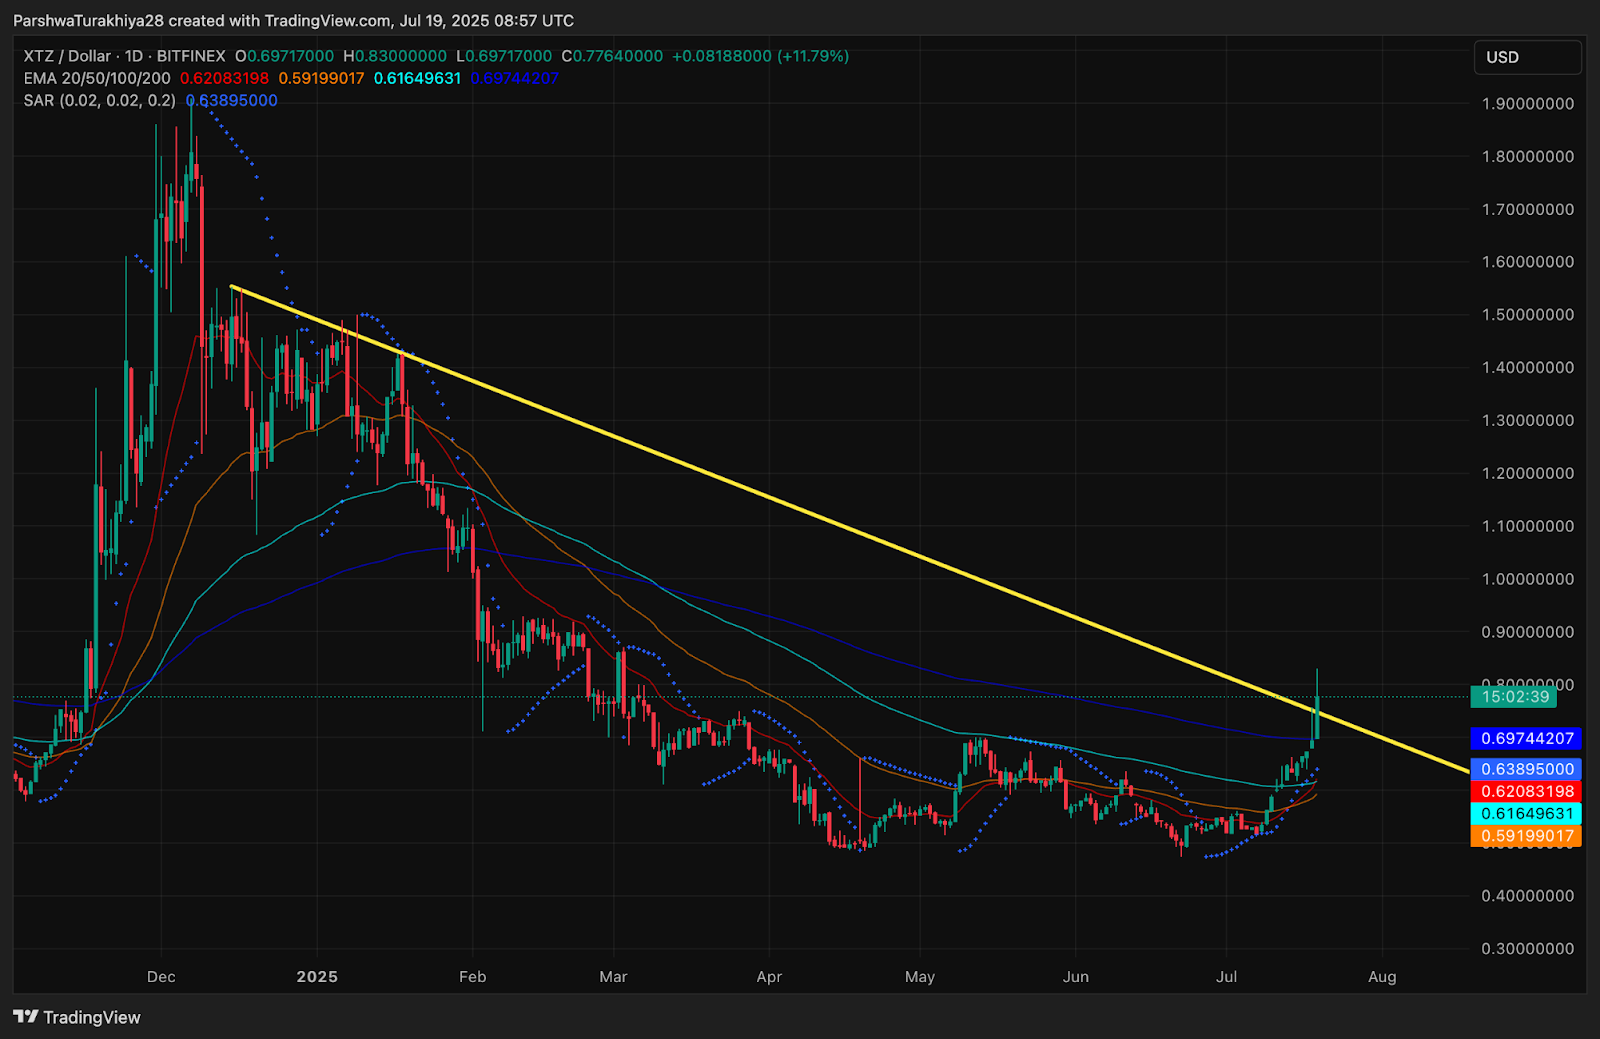
On the daily chart, XTZ has officially breached a descending trendline stretching back to early January 2025. The breakout was confirmed by a strong candle close above $0.75 and accompanied by a full stack of bullish exponential moving averages (EMA 20/50/100/200). This marks a critical structural shift from lower highs to a potential uptrend.
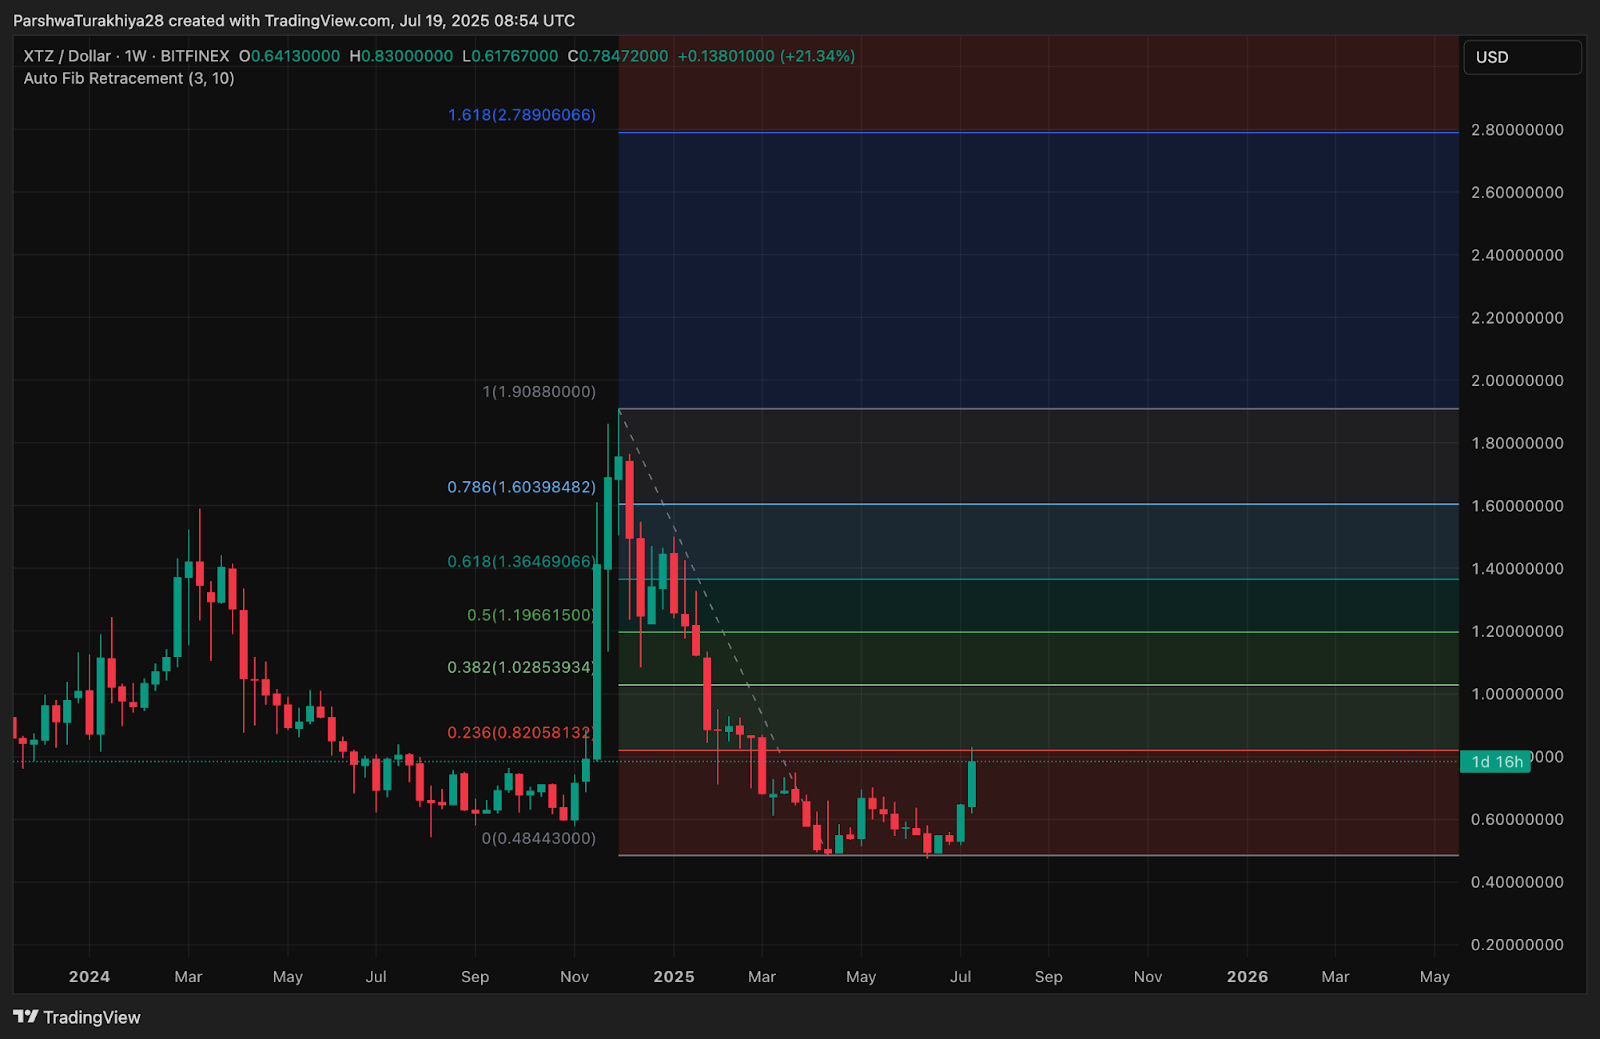
The weekly Fibonacci retracement from the November 2024 high to the March 2025 low shows XTZ now reclaiming the 0.236 Fib level at $0.82. This opens the door to test higher retracement levels, with $1.03 (0.382 Fib), $1.19 (0.5), and $1.36 (0.618) acting as medium-term upside targets.
In addition, the Parabolic SAR has flippe…
The post Tezos (XTZ) Price Prediction for July 20, 2025: XTZ Breaks Downtrend With 21% Weekly Rally appeared first on Coin Edition.
Читать больше

Pudgy Penguins (PENGU) Price Prediction for July 27

Floki (FLOKI) Price Prediction for July 27, 2025
Tezos (XTZ) Price Prediction for July 20, 2025: XTZ Breaks Downtrend With 21% Weekly Rally
Tezos price has broken above its long-standing descending trendline for the first time in nearly seven months. The breakout, backed by strong volume and bullish indicator alignment, comes after XTZ rallied over 21% this week. As of writing, Tezos price today stands at $0.776, testing the 0.236 Fibonacci retracement level and eyeing the $0.82–$0.85 zone as its next challenge.
What’s Happening With Tezos’ Price?
On the daily chart, XTZ has officially breached a descending trendline stretching back to early January 2025. The breakout was confirmed by a strong candle close above $0.75 and accompanied by a full stack of bullish exponential moving averages (EMA 20/50/100/200). This marks a critical structural shift from lower highs to a potential uptrend.
The weekly Fibonacci retracement from the November 2024 high to the March 2025 low shows XTZ now reclaiming the 0.236 Fib level at $0.82. This opens the door to test higher retracement levels, with $1.03 (0.382 Fib), $1.19 (0.5), and $1.36 (0.618) acting as medium-term upside targets.
In addition, the Parabolic SAR has flippe…
The post Tezos (XTZ) Price Prediction for July 20, 2025: XTZ Breaks Downtrend With 21% Weekly Rally appeared first on Coin Edition.
Читать больше
Pudgy Penguins (PENGU) Price Prediction for July 27