


Dogecoin Shows ‘Clean’ Bullish Divergence Amid Market Turmoil: Crypto Analyst

After Dogecoin temporarily fell by more than 22% yesterday amid rumors of a “Black Friday”, the price has since been able to recover at least some of its losses. Nevertheless, DOGE is still down around 11% since the start of the week. This has put the price of Dogecoin in a tricky situation.
Dogecoin Forms Bull Div
Dogecoin breached a critical ascending support line before quickly recovering, a behavior that crypto analyst Kevin (@Kev_Capital_TA) describes as testing the “lines in the sand” for this ongoing bull market structure.
Related Reading: Dogecoin Crashes 20%, But ‘Bull Line’ Signals Hope For HODLers
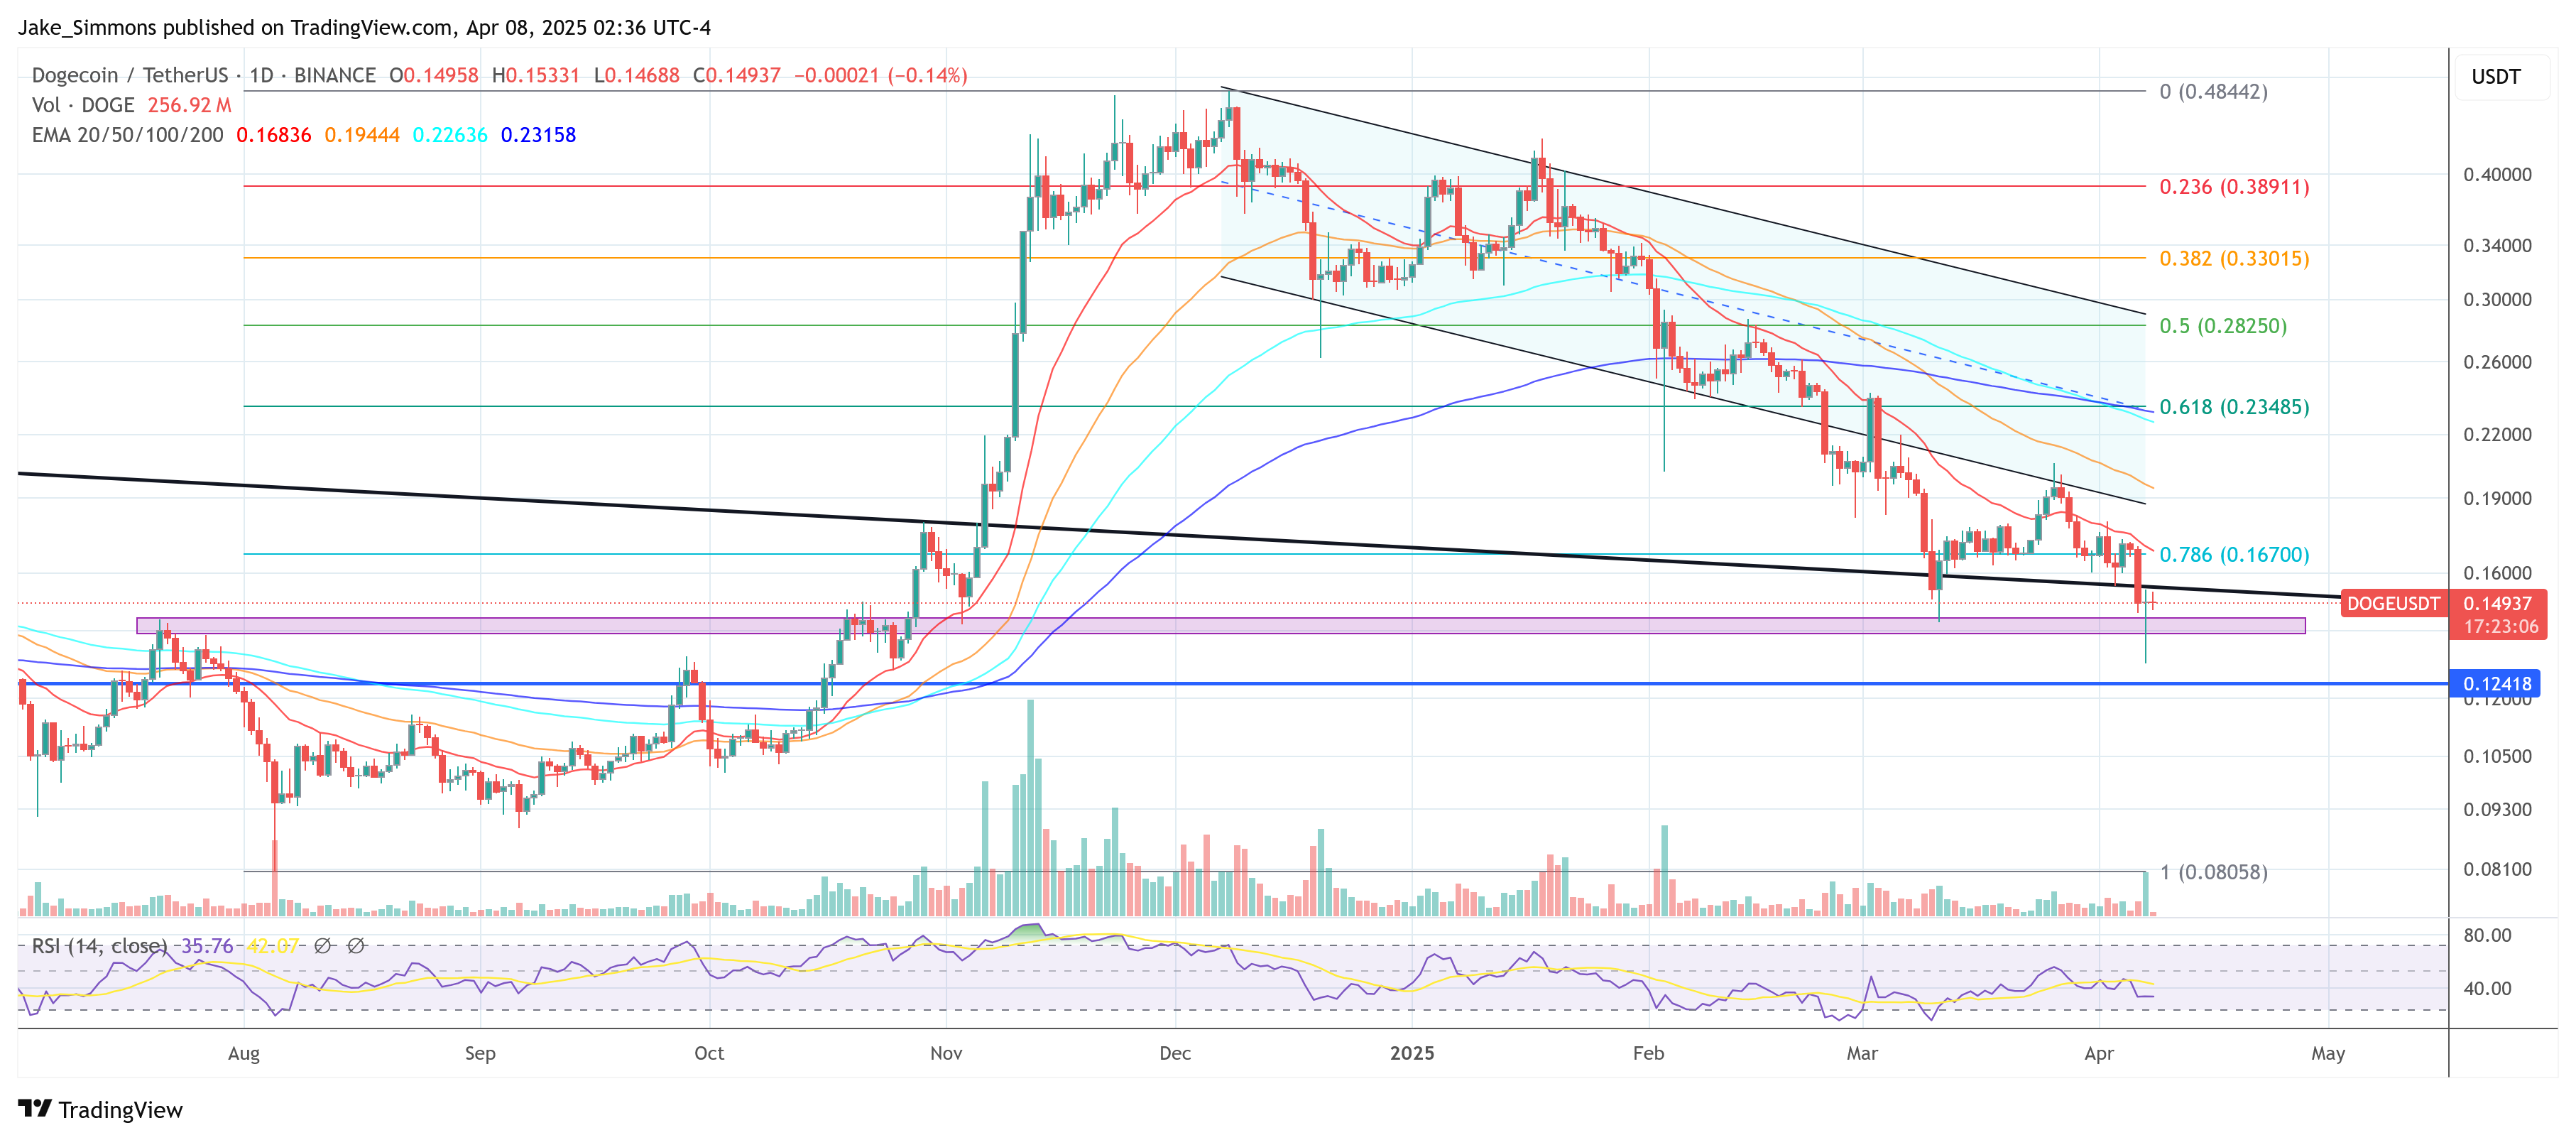
Kevin’s shared chart indicates that DOGE temporarily dipped below a rising pink trendline that has been in place since mid-2023, yet managed to close the daily candle back above this historically significant support around the $0.138 region—a level that also coincides with the 38.2% Fibonacci retracement level measured from the $0.049 swing low to the approximately $0.738 peak.
The analyst points out that, despite the intraday break, DOGE’s recovery formed what he calls a “clean bullish divergence” on the daily time frame, referencing the Relative Strength Index which has begun climbing even as price made a slightly lower low. He likened this development to a similar divergence unfolding on Bitcoin’s chart, suggesting that Dogecoin’s momentum may be stabilizing after a series of drawn-out declines from the $0.48 high set early December last year.
DOGE Uptrend Remains Intact
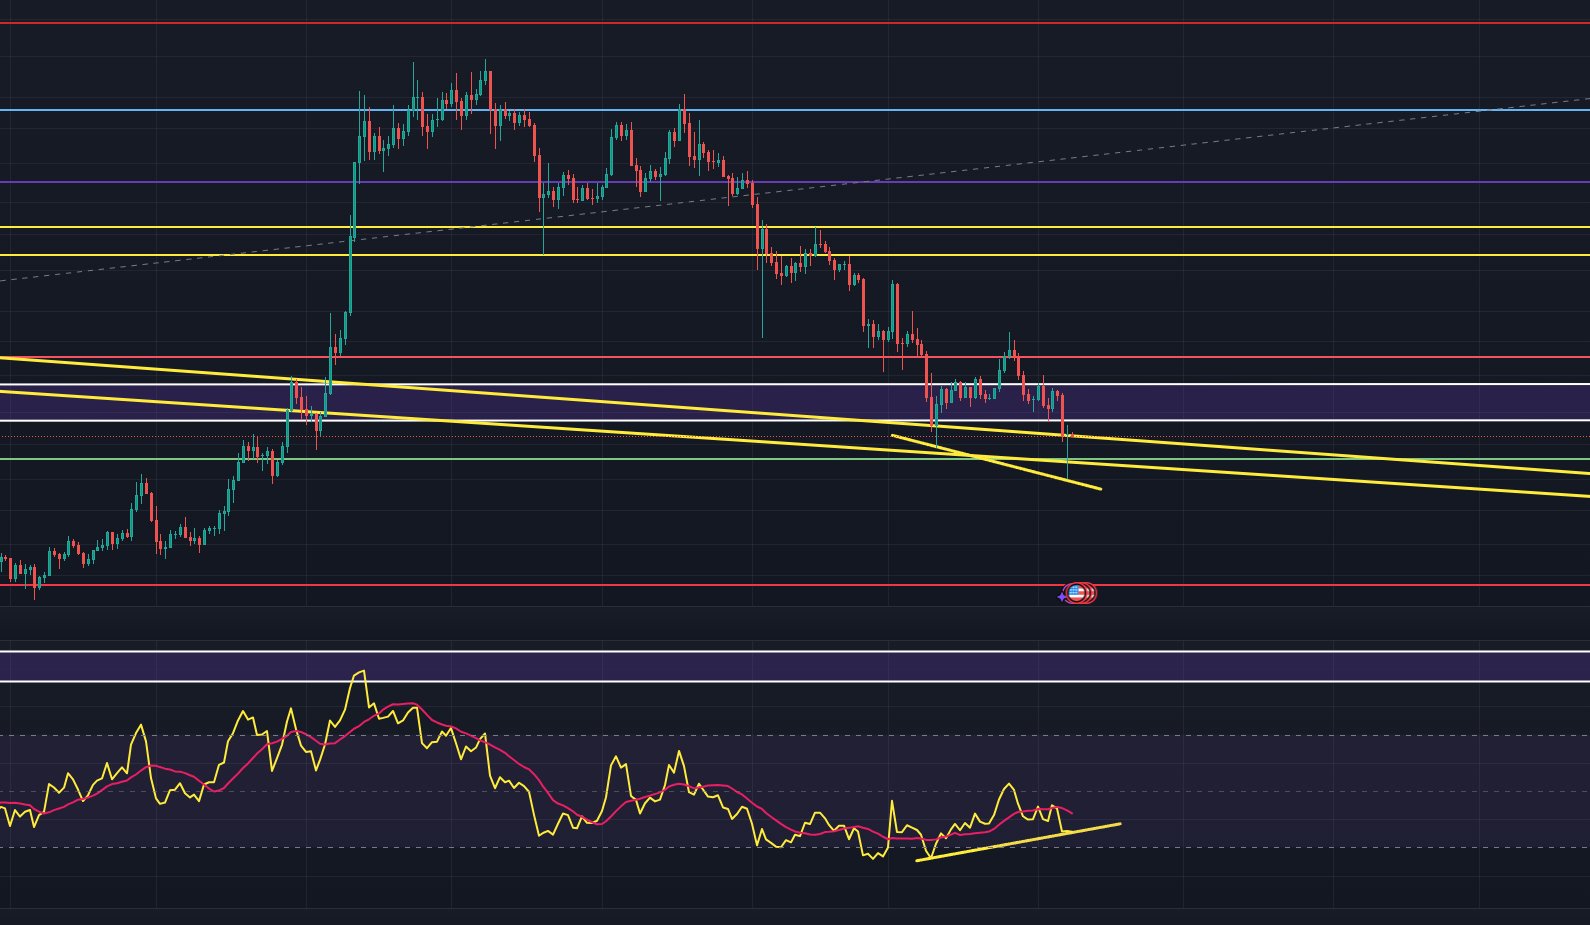
Charting Guy (@ChartingGuy) weighed in separately, highlighting that Dogecoin has arrived once more at its weekly 200 EMA zone—an important trend marker hovering in the mid-$0.13 range—and that its overall structure still shows “higher highs, higher lows” when viewed on a broader timescale.
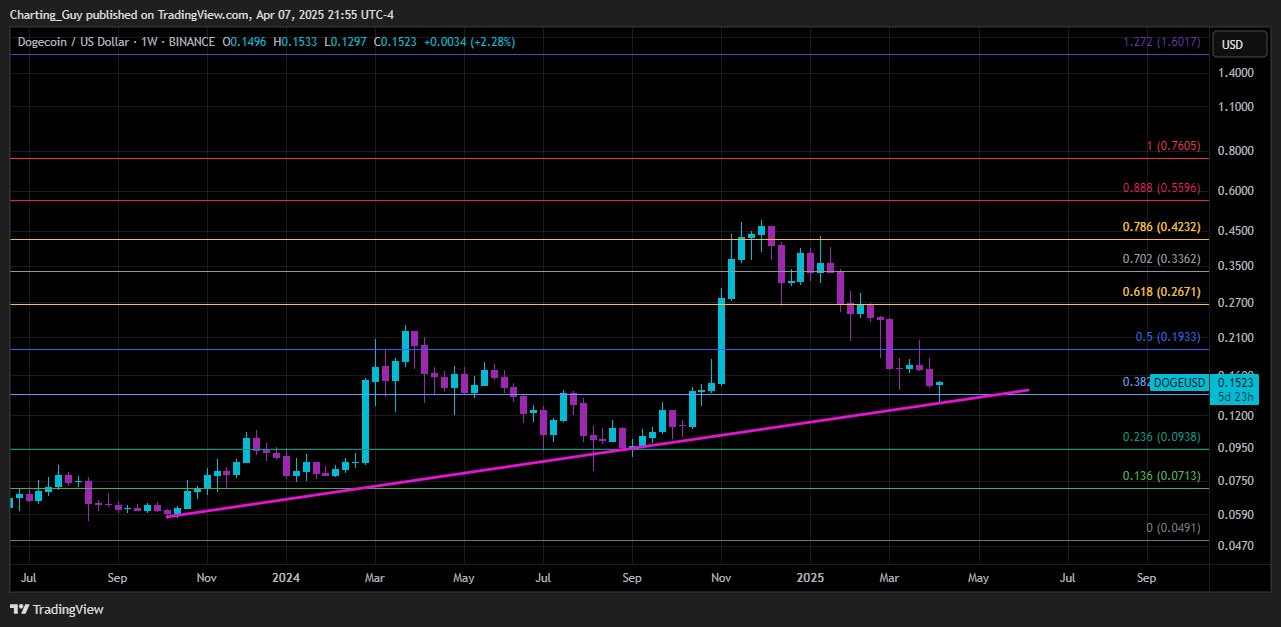
His posted chart also features a Fibonacci analysis which shows that DOGE could manage to close above the 0.382 Fib level, reinforcing the notion that DOGE’s ability to hold above $0.15 could be a crucial gauge of bullish continuation. Failure to sustain this level, however, would risk revisiting deeper Fibonacci support levels, including the 23.6% retracement near $0.09 or even the 13.6% level around $0.07.
On the upside, traders may look to potential resistance zones in the mid-$0.20s, which line up with the 61.8% Fibonacci retracement at roughly $0.2671, and the high-$0.30s to low-$0.40s range tied to deeper retracement zones up to the 78.6% mark.
The chart watcher also notes that a retest of the prior swing highs above $0.40 would align with an extended push toward the 88.8% Fibonacci near $0.56, although market participants remain cautious amid the broader volatility that is brought to the market by US President Donald Trump’s tariff policies.
At press time, DOGE traded at $0.149.
Читать больше
Binance Futures Show Dogecoin Traders Are Heavily Long—Too Bullish To Fail?

Dogecoin Price To Enter Phase E After Testing Last Point Of Support, Here’s The Target
Dogecoin Shows ‘Clean’ Bullish Divergence Amid Market Turmoil: Crypto Analyst
After Dogecoin temporarily fell by more than 22% yesterday amid rumors of a “Black Friday”, the price has since been able to recover at least some of its losses. Nevertheless, DOGE is still down around 11% since the start of the week. This has put the price of Dogecoin in a tricky situation.
Dogecoin Forms Bull Div
Dogecoin breached a critical ascending support line before quickly recovering, a behavior that crypto analyst Kevin (@Kev_Capital_TA) describes as testing the “lines in the sand” for this ongoing bull market structure.
Related Reading: Dogecoin Crashes 20%, But ‘Bull Line’ Signals Hope For HODLers
Kevin’s shared chart indicates that DOGE temporarily dipped below a rising pink trendline that has been in place since mid-2023, yet managed to close the daily candle back above this historically significant support around the $0.138 region—a level that also coincides with the 38.2% Fibonacci retracement level measured from the $0.049 swing low to the approximately $0.738 peak.
The analyst points out that, despite the intraday break, DOGE’s recovery formed what he calls a “clean bullish divergence” on the daily time frame, referencing the Relative Strength Index which has begun climbing even as price made a slightly lower low. He likened this development to a similar divergence unfolding on Bitcoin’s chart, suggesting that Dogecoin’s momentum may be stabilizing after a series of drawn-out declines from the $0.48 high set early December last year.
DOGE Uptrend Remains Intact
Charting Guy (@ChartingGuy) weighed in separately, highlighting that Dogecoin has arrived once more at its weekly 200 EMA zone—an important trend marker hovering in the mid-$0.13 range—and that its overall structure still shows “higher highs, higher lows” when viewed on a broader timescale.
His posted chart also features a Fibonacci analysis which shows that DOGE could manage to close above the 0.382 Fib level, reinforcing the notion that DOGE’s ability to hold above $0.15 could be a crucial gauge of bullish continuation. Failure to sustain this level, however, would risk revisiting deeper Fibonacci support levels, including the 23.6% retracement near $0.09 or even the 13.6% level around $0.07.
On the upside, traders may look to potential resistance zones in the mid-$0.20s, which line up with the 61.8% Fibonacci retracement at roughly $0.2671, and the high-$0.30s to low-$0.40s range tied to deeper retracement zones up to the 78.6% mark.
The chart watcher also notes that a retest of the prior swing highs above $0.40 would align with an extended push toward the 88.8% Fibonacci near $0.56, although market participants remain cautious amid the broader volatility that is brought to the market by US President Donald Trump’s tariff policies.
At press time, DOGE traded at $0.149.
Читать больше
Binance Futures Show Dogecoin Traders Are Heavily Long—Too Bullish To Fail?