


Bitcoin Bull Run Cycle? Chart Points to Next Phase for BTC with Price Analysis

- Bitcoin is very close to the 20-day EMA which stands at $97,141.
- Bitcoin is currently in a bullish phase of the cycle and could soar to a new ATH soon.
- If BTC reclaims the 20-day EMA and breaks out of the upper BB, $100K is likely.
Bitcoin (BTC) is once again at a turning point. The latest chart shared by “Mags” on X platform takes a look at the digital asset’s long-term cycle and its possible next phase. The chart zeroes in on Bitcoin’s cyclical nature, especially its price moves around halving events.
According to a Mag’s post, Bitcoin usually follows a fairly predictable pattern. It kicks off with the halving event, then a strong rally, hitting a peak before a bear market takes over.
Finally, once the cryptocurrency hits rock bottom in the bear market, it turns bullish again with the next halving event.
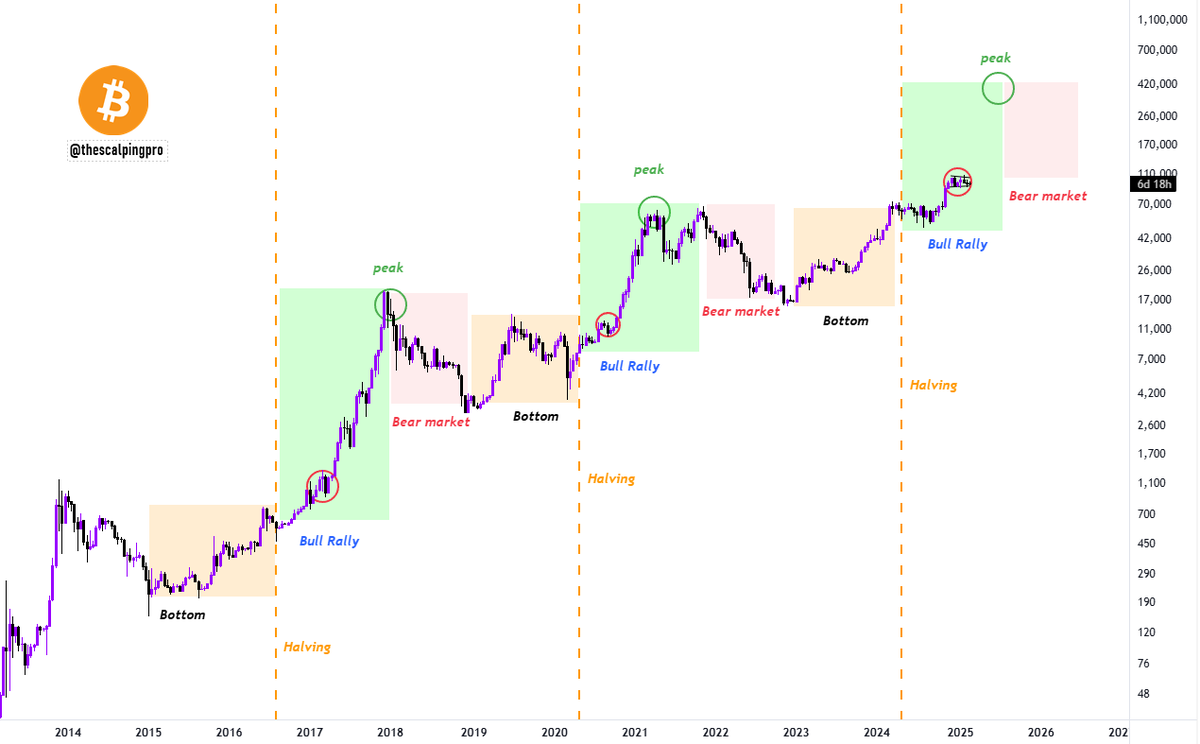
Halving Events: Fueling Bitcoin’s Cyclical Rallies
This cycle has played out multiple times in the past, and it looks like BTC is in the bull rally phase after the 2024 halving. Historically, each halving kicks off a supply shock, often leading to a huge rally before prices peak, followed by a bear market.
Looking at “Mags’” ch…
The post Bitcoin Bull Run Cycle? Chart Points to Next Phase for BTC with Price Analysis appeared first on Coin Edition.
Читать больше
Bitcoin (BTC) Price Prediction for May 14

Bitcoin Bull Run Cycle? Chart Points to Next Phase for BTC with Price Analysis
- Bitcoin is very close to the 20-day EMA which stands at $97,141.
- Bitcoin is currently in a bullish phase of the cycle and could soar to a new ATH soon.
- If BTC reclaims the 20-day EMA and breaks out of the upper BB, $100K is likely.
Bitcoin (BTC) is once again at a turning point. The latest chart shared by “Mags” on X platform takes a look at the digital asset’s long-term cycle and its possible next phase. The chart zeroes in on Bitcoin’s cyclical nature, especially its price moves around halving events.
According to a Mag’s post, Bitcoin usually follows a fairly predictable pattern. It kicks off with the halving event, then a strong rally, hitting a peak before a bear market takes over.
Finally, once the cryptocurrency hits rock bottom in the bear market, it turns bullish again with the next halving event.
Halving Events: Fueling Bitcoin’s Cyclical Rallies
This cycle has played out multiple times in the past, and it looks like BTC is in the bull rally phase after the 2024 halving. Historically, each halving kicks off a supply shock, often leading to a huge rally before prices peak, followed by a bear market.
Looking at “Mags’” ch…
The post Bitcoin Bull Run Cycle? Chart Points to Next Phase for BTC with Price Analysis appeared first on Coin Edition.
Читать больше