Will Bitcoin Bounce or Break at $110K–$108K? Make-or-Break Levels

- Bitcoin is currently trading at around the $109.3K range.
- The market has seen $246.70 million in BTC liquidations.
The crypto assets have entered the bearish zone, with their price action going down. Notably, the market cap has slipped by over 1.87%, reaching $3.75 trillion. The largest asset, Bitcoin (BTC), after a series of ups and downs, is still seeking to escape the bear trap. BTC has stepped into the fear zone as the Fear and Greed Index value holds at 28.
BTC is one of the trending coins, which posted a loss of over 2.14% in the last 24 hours. The asset opened the day trading at a high range at around $112,221. Later, as the bears entered the market, it pushed BTC to a bottom level of $108,713. At the time of writing, Bitcoin is trading at around the $109,394 mark.
The daily trading volume has surged by over 39.95%, reaching $70.02 billion. Furthermore, during this period, the market has experienced a liquidation of $246.70 million worth of Bitcoin, as reported by the Coinglass data.
The BTC cost basis distribution heatmap shows the price ranges where the holders purchased their coins. In this chart, $110,176 and $108,531 stand out as key support zones. If the price approaches these levels, the selling pressure may reduce, as holders are less likely to sell at a loss; it potentially stabilises BTC.
Will the Bitcoin Bull Run Resume or the Floor Break?
The BTC/USDT pair’s technical indicator analysis exhibits a bearish outlook, with red candles having formed. The Moving Average Convergence Divergence and signal line are stationed below the zero line, indicating a downtrend. Although the MACD crosses above the signal line, the overall momentum is still weak.
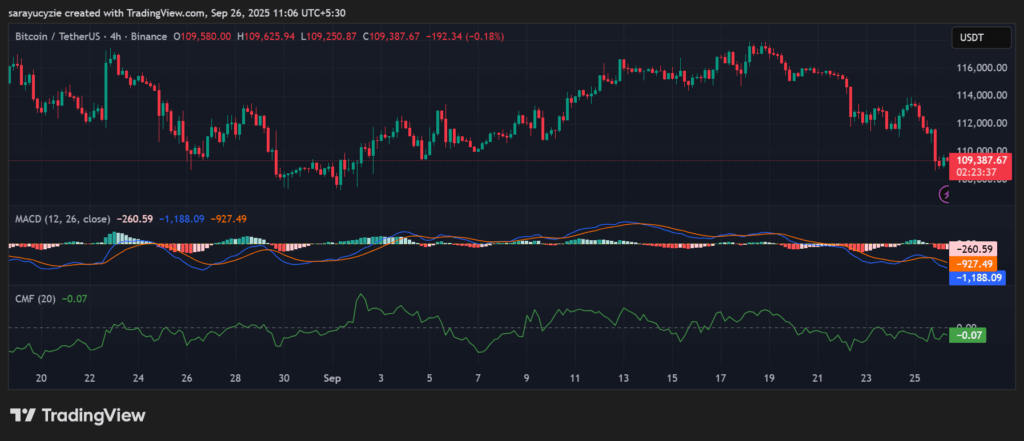
In addition, the indicator used to assess the capital flow, the Chaikin Money Flow (CMF) of Bitcoin, is found at -0.07, which is negative, suggesting a slight selling pressure in the market. Also, more money is flowing out of the asset than into it. The price may likely weaken or face downward pressure.
With the Bitcoin price painted in a red graph, it could slip and find its key support at the $109,384 range. An extended correction on the downside might apply additional pressure, likely inviting the death cross to emerge. The bears would take the asset’s price to the $109,374 mark or even lower.
Assuming the momentum of the asset reversed, it hints at a bullish turn. The price might climb and test the $109,404 resistance level. A further upside correction could trigger Bitcoin to initiate the formation of the golden cross, with the bulls leading the price up to the $109,414 zone or higher.
Bitcoin’s daily Relative Strength Index (RSI) is positioned at 29.17, signalling that it is approaching oversold conditions. This could lead to a potential rebound. Moreover, the Bull Bear Power (BBP) reading of -3,351.64 implies a strong bearish dominance in the market. The deeper the negative number, the stronger the selling pressure.
To understand the road ahead for BTC, check out our comprehensive Bitcoin (BTC) Price Forecast for 2025, 2026, and the years through 2030.
Highlighted Crypto News
PYUSD Stablecoin Market Cap Crosses $1.8B, PayPal USD Now Ranks 53
Читать больше


Will Bitcoin Bounce or Break at $110K–$108K? Make-or-Break Levels
- Bitcoin is currently trading at around the $109.3K range.
- The market has seen $246.70 million in BTC liquidations.
The crypto assets have entered the bearish zone, with their price action going down. Notably, the market cap has slipped by over 1.87%, reaching $3.75 trillion. The largest asset, Bitcoin (BTC), after a series of ups and downs, is still seeking to escape the bear trap. BTC has stepped into the fear zone as the Fear and Greed Index value holds at 28.
BTC is one of the trending coins, which posted a loss of over 2.14% in the last 24 hours. The asset opened the day trading at a high range at around $112,221. Later, as the bears entered the market, it pushed BTC to a bottom level of $108,713. At the time of writing, Bitcoin is trading at around the $109,394 mark.
The daily trading volume has surged by over 39.95%, reaching $70.02 billion. Furthermore, during this period, the market has experienced a liquidation of $246.70 million worth of Bitcoin, as reported by the Coinglass data.
The BTC cost basis distribution heatmap shows the price ranges where the holders purchased their coins. In this chart, $110,176 and $108,531 stand out as key support zones. If the price approaches these levels, the selling pressure may reduce, as holders are less likely to sell at a loss; it potentially stabilises BTC.
Will the Bitcoin Bull Run Resume or the Floor Break?
The BTC/USDT pair’s technical indicator analysis exhibits a bearish outlook, with red candles having formed. The Moving Average Convergence Divergence and signal line are stationed below the zero line, indicating a downtrend. Although the MACD crosses above the signal line, the overall momentum is still weak.
In addition, the indicator used to assess the capital flow, the Chaikin Money Flow (CMF) of Bitcoin, is found at -0.07, which is negative, suggesting a slight selling pressure in the market. Also, more money is flowing out of the asset than into it. The price may likely weaken or face downward pressure.
With the Bitcoin price painted in a red graph, it could slip and find its key support at the $109,384 range. An extended correction on the downside might apply additional pressure, likely inviting the death cross to emerge. The bears would take the asset’s price to the $109,374 mark or even lower.
Assuming the momentum of the asset reversed, it hints at a bullish turn. The price might climb and test the $109,404 resistance level. A further upside correction could trigger Bitcoin to initiate the formation of the golden cross, with the bulls leading the price up to the $109,414 zone or higher.
Bitcoin’s daily Relative Strength Index (RSI) is positioned at 29.17, signalling that it is approaching oversold conditions. This could lead to a potential rebound. Moreover, the Bull Bear Power (BBP) reading of -3,351.64 implies a strong bearish dominance in the market. The deeper the negative number, the stronger the selling pressure.
To understand the road ahead for BTC, check out our comprehensive Bitcoin (BTC) Price Forecast for 2025, 2026, and the years through 2030.
Highlighted Crypto News
PYUSD Stablecoin Market Cap Crosses $1.8B, PayPal USD Now Ranks 53
Читать больше