Ripple Price Analysis: How Low Can XRP Go if It Loses $1 Support This Weekend?
Поделиться:
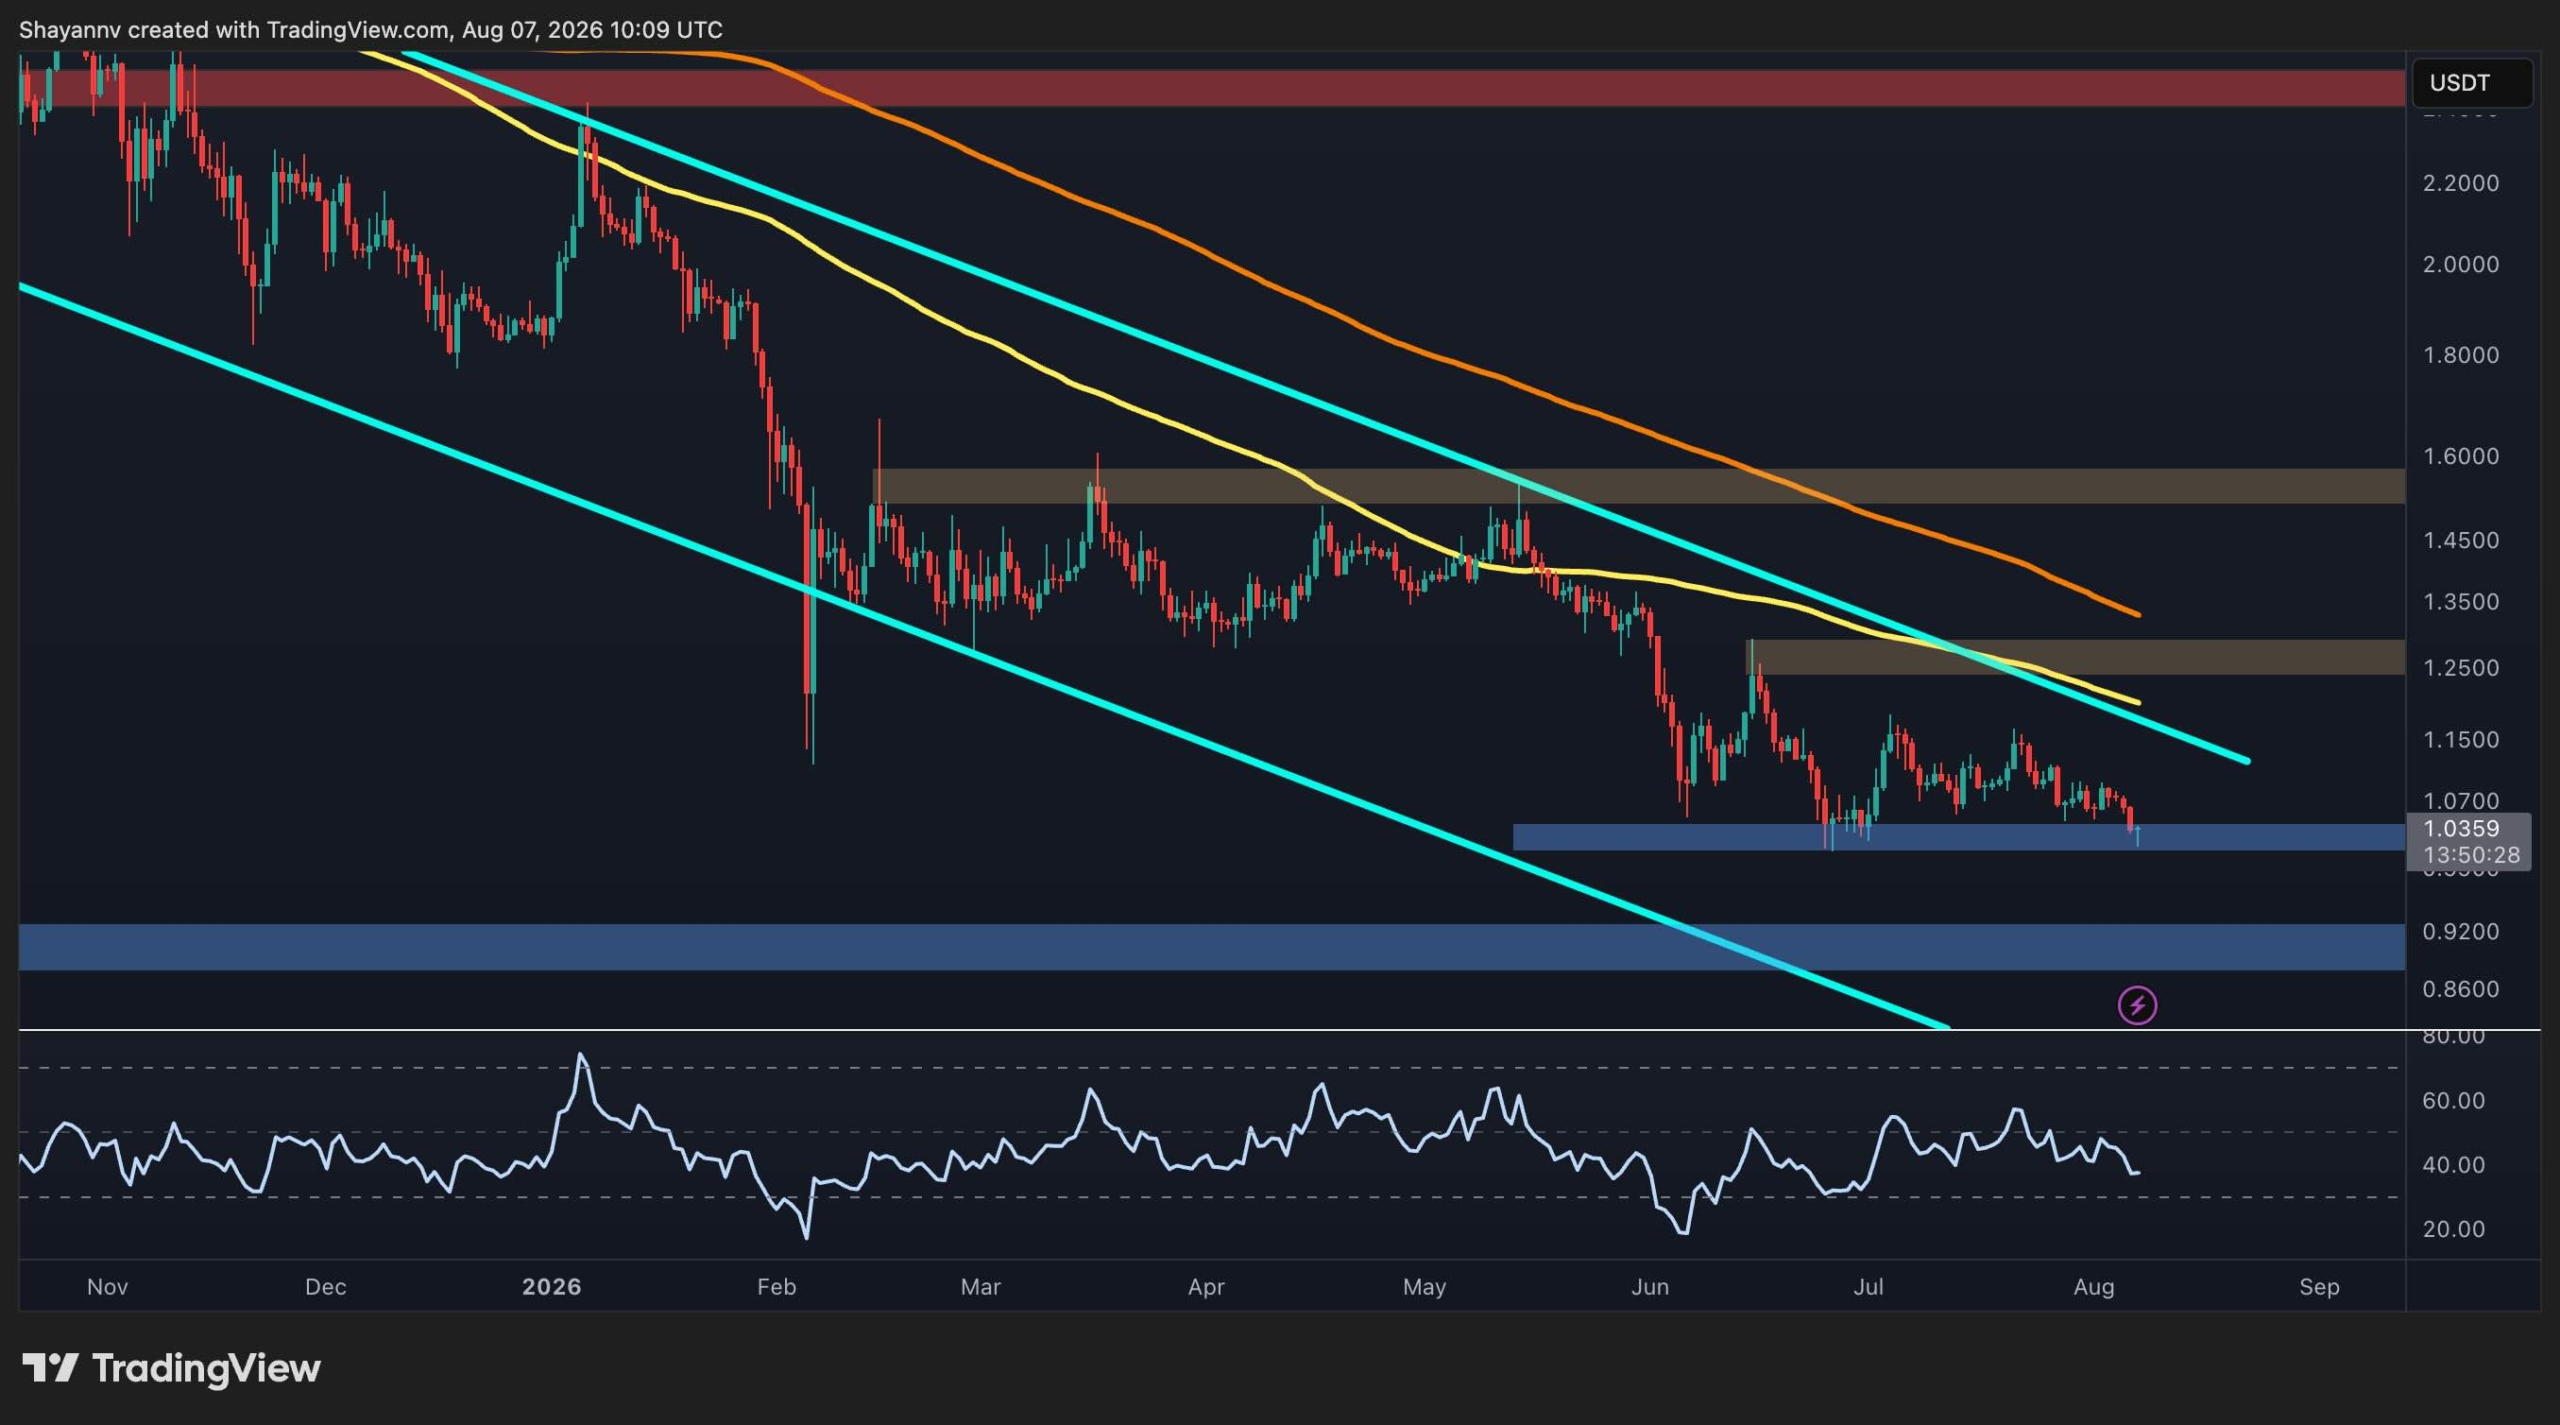
XRP is under sustained selling pressure in crypto markets versus USDT and BTC, with a higher-timeframe structure favoring bears after a breakdown below key horizontal support. On the XRP/USDT chart the price trades in a defined descending channel and remains below the 100-day and 200-day moving averages, with the 100-day acting as dynamic resistance and the 200-day trending lower well above current price. This technical weakness increases downside risk for the token unless buyers quickly reclaim lost levels.
Рынки предсказаний
Что в фокусе у трейдеров?

XRP remains under sustained selling pressure against both USDT and BTC, with the higher time frame structure continuing to favor the bears. The latest breakdown below the key horizontal support reinforces the prevailing downtrend and leaves the market vulnerable to another leg lower unless buyers quickly reclaim the lost levels.
Ripple Price Analysis: The USDT Pair
On the XRP/USDT chart, the price continues to trade inside a well-defined descending channel while remaining below the 100-day and 200-day moving averages. The 100-day MA has acted as a close dynamic resistance throughout the decline, while the 200-day MA continues to trend lower well above the current price, highlighting the weakness in the broader trend.


Читать больше

XRP türev piyasasında 9,6 milyon dolarlık long pozisyon silindi