Pound Sterling Faces Stiff Resistance at July High: What’s Next for GBP/USD?
Поделиться:
GBP/USD has stalled at its July high, failing to clear a key technical resistance and signaling waning bullish momentum; daily RSI shows potential bearish divergence and MACD may be nearing a bearish crossover, with immediate support at the recent consolidation zone and the 50-day moving average. The next direction hinges on Bank of England vs Federal Reserve signals and upcoming US inflation/employment data, with a stronger dollar likely to pressure the pound and broader risk assets including crypto and DeFi, while a daily close above the July high would confirm a bullish breakout.
Рынки предсказаний
Что в фокусе у трейдеров?

BitcoinWorld
Pound Sterling Faces Stiff Resistance at July High: What’s Next for GBP/USD?
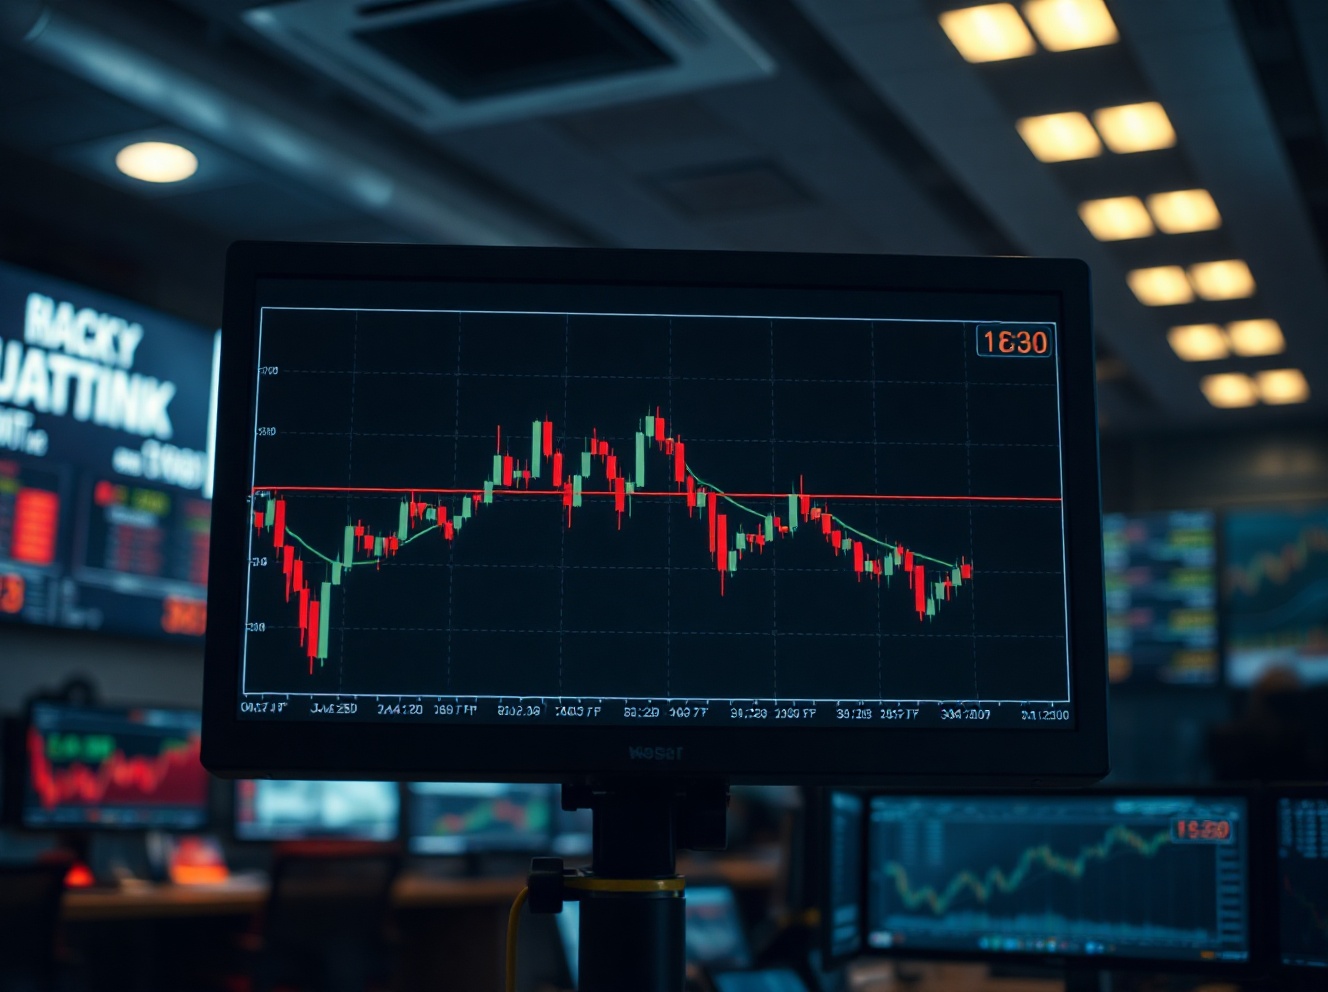
The British pound has run out of momentum at its July high against the US dollar, stalling at a key technical resistance level that could determine the currency pair’s next major directional move. As of the latest trading session, GBP/USD is struggling to break above the peak it established in July, a level that market participants are closely watching for signs of a breakout or a potential reversal.
Why the July High Matters for Sterling Traders
The July high represents a significant price point on the GBP/USD chart, acting as a ceiling where selling pressure has historically outweighed buying interest. This level is not just an arbitrary marker; it is a confluence of prior price action and psychological barriers that traders use to gauge market sentiment. When a currency pair repeatedly fails to surpass a specific high, it often signals that the market is not yet convinced of the underlying strength of the currency, leading to consolidation or a pullback.
For the pound, this resistance comes after a period of recovery and relative strength against the dollar. The stall suggests that the recent bullish momentum has cooled, with buyers unable to push the price to new highs. This is a critical juncture because a failure to break above this level could lead to profit-taking and a short-term bearish trend, while a successful breakout would confirm a more robust uptrend and could open the door to higher price targets.
Market Drivers and Economic Context
The movement of GBP/USD is heavily influenced by the divergent monetary policies of the Bank of England (BoE) and the Federal Reserve. Traders are currently parsing economic data and central bank commentary to anticipate future interest rate decisions. The pound’s recent strength has been partly supported by expectations that the BoE might maintain a more hawkish stance than the Fed, especially if UK inflation remains sticky.
However, the stall at the July high indicates that the market may have already priced in much of this optimism. Furthermore, global risk sentiment, US economic resilience, and geopolitical events continue to play a significant role in driving demand for the safe-haven dollar. If upcoming US data, such as employment or inflation figures, comes in stronger than expected, it could bolster the dollar and put additional downward pressure on the pound, making the resistance level even more challenging to overcome.
Technical Indicators and Key Levels to Watch
Technical analysts are looking at several indicators to gauge the next move. The Relative Strength Index (RSI) on the daily chart is a key metric; if it shows bearish divergence, it could signal that the upward momentum is waning. Additionally, the Moving Average Convergence Divergence (MACD) indicator might be on the verge of a bearish crossover, which would be another sign of weakening bullish pressure.
Immediate support for GBP/USD is seen at the recent consolidation zone, followed by the 50-day moving average. A break below these levels could accelerate selling. On the upside, a daily close above the July high would be the first confirmation of a breakout, with the next resistance levels likely to be found at psychological figures or prior swing highs from earlier in the year. Traders are advised to watch these levels closely, as a decisive move in either direction is likely to set the tone for the coming weeks.
Conclusion
The pound’s inability to push beyond the July high against the dollar marks a pause in its recent uptrend, placing the focus squarely on this critical technical juncture. The outcome of this battle between buyers and sellers will likely be dictated by incoming economic data and central bank signals from both the UK and the US. For now, the market is in a wait-and-see mode, with the potential for increased volatility once a clear direction is established.
FAQs
Q1: What does it mean when a currency pair stalls at a high?
A stall at a high, or resistance level, indicates that selling pressure is strong enough to absorb buying interest, preventing the price from rising further. It suggests the market is undecided about the currency’s future direction and often leads to a period of consolidation or a price pullback.
Q2: Why is the July high a significant level for GBP/USD?
The July high is significant because it is a recent price extreme where a large number of traders have placed sell orders. It acts as a technical barrier. A break above it signals renewed bullish momentum, while a rejection from it often confirms a short-term bearish trend.
Q3: What factors could trigger a breakout above the July high?
A breakout would likely require a catalyst, such as the Bank of England signaling a more aggressive interest rate hike path than the Federal Reserve, or a weaker-than-expected US economic report that dampens dollar demand. Positive UK economic data could also provide the necessary momentum for buyers to overcome the resistance.
This post Pound Sterling Faces Stiff Resistance at July High: What’s Next for GBP/USD? first appeared on BitcoinWorld.
В этой новости
Монеты

$ 1.35
-0.18%Рынки предсказаний
Что в фокусе у трейдеров?
Поделиться:
В этой новости
Монеты
$ 1.35
-0.18%Рынки предсказаний
Что в фокусе у трейдеров?
Поделиться:
Читать больше

EUR/USD Flatlines Below 1.1550 as Bearish Bias Persists Under 100-Day SMA